Max Verstappen won the 2024 São Paulo Grand Prix after starting P17 in difficult wet conditions. This study
separates the contribution of his opening recovery, the Lap 28 pit decisions, the subsequent red flag and his
pace after the final restart.
Independent analysis using publicly available data. Not affiliated with Formula 1 or any Formula 1 team.
Wet-weather strategy
Position reconstruction
Red-flag scenario
Post-restart pace
Executive summary
The result in four measures
Verstappen created most of the recovery on track, gained race-winning position during the Lap 28 pit split,
then converted that opportunity with the strongest pace after the final restart.
On-track recovery before the VSC
P17 → P5Twelve positions gained before the central strategic sequence.
Gain when leading rivals stopped
+3 positionsThe Lap 28 pit split moved Verstappen from P5 to P2.
Observed same-window Lap 28 stop estimate
~26 secondsA scenario input, not a certain cost for every alternative strategy.
Final-stint advantage over comparison drivers
0.70–0.97 s/lapMean advantage across 26 shared clean laps.
Race reconstruction
The Recovery Was Already Underway
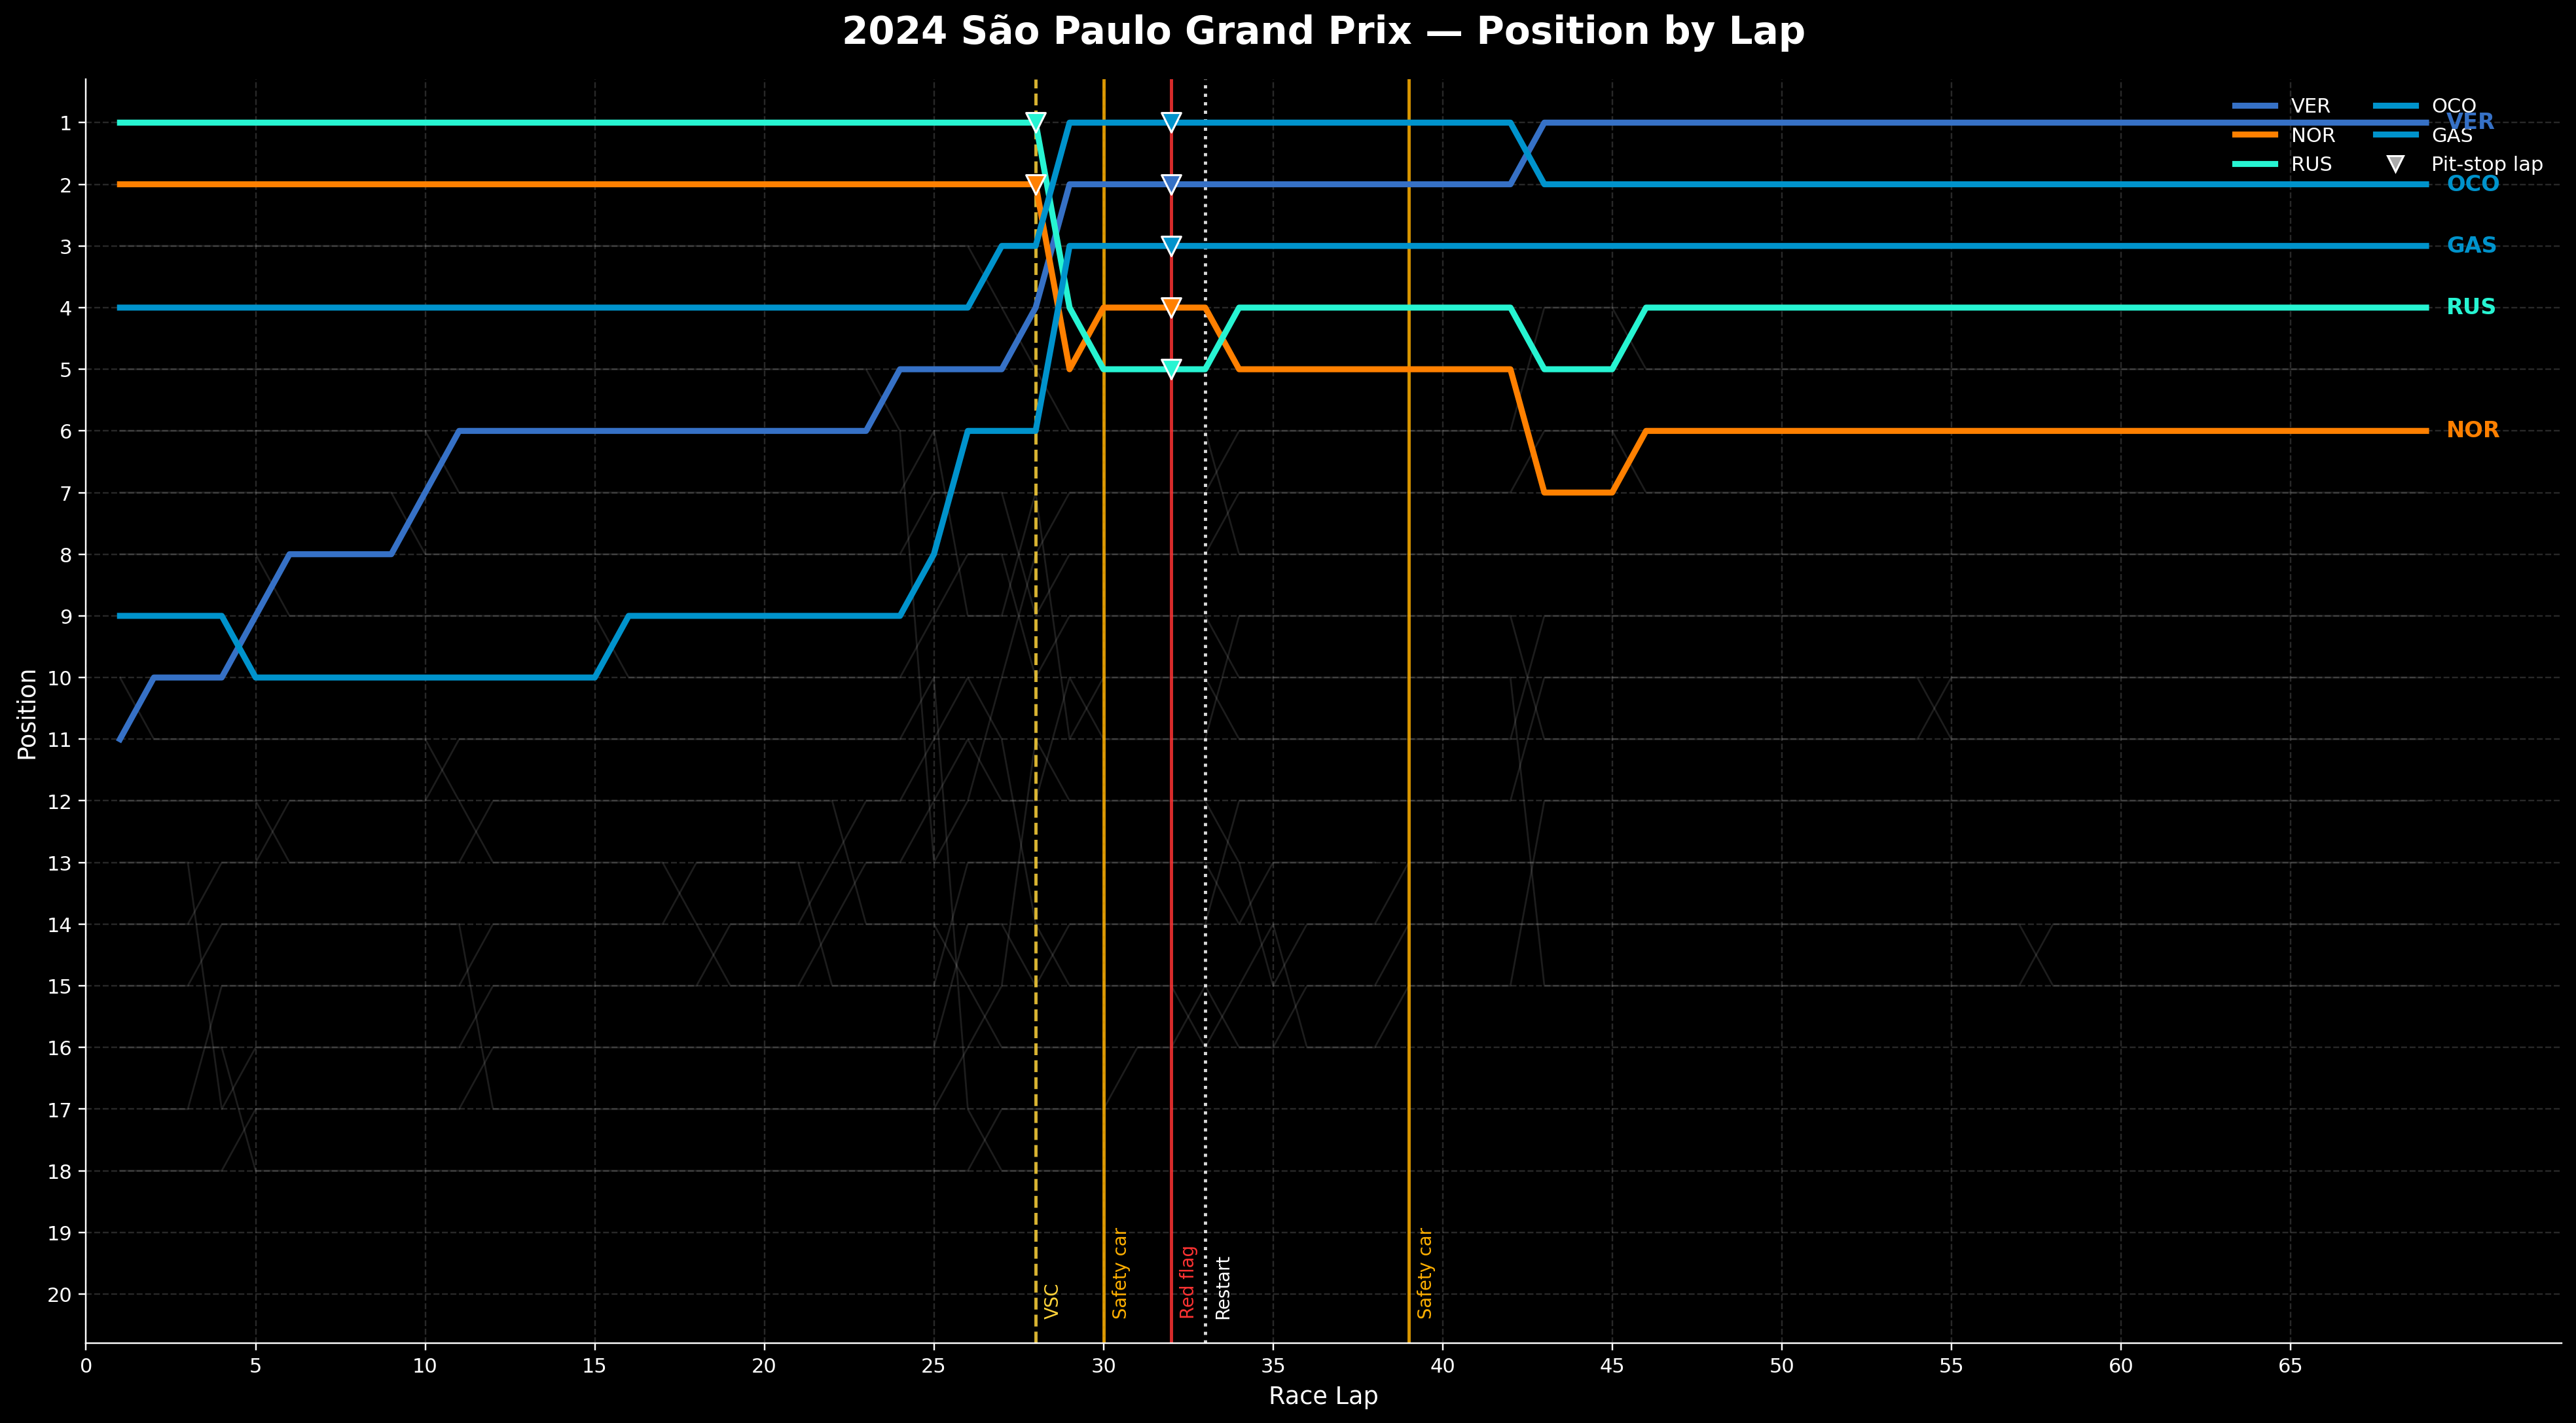
Verstappen gained six positions on the opening lap, moving from P17 to P11. He then gained another six
positions through the wet-weather opening phase, reaching P5 before the Virtual Safety Car on Lap 28.
Twelve of his sixteen total positions had therefore been gained before the central strategic sequence.
Lap 1P17 to P11
Before Lap 28P11 to P5
Lap 28Virtual Safety Car
Lap 30Safety Car
Lap 32Red flag
Lap 39Second Safety Car
View full resolution
Position-by-lap reconstruction for Verstappen, Norris, Russell, Ocon and Gasly. Verstappen had already
reached P5 before the Lap 28 VSC and the subsequent pit sequence. Select the chart to inspect the
full-resolution figure.
Position-gain decomposition
Where the Sixteen Positions Came From
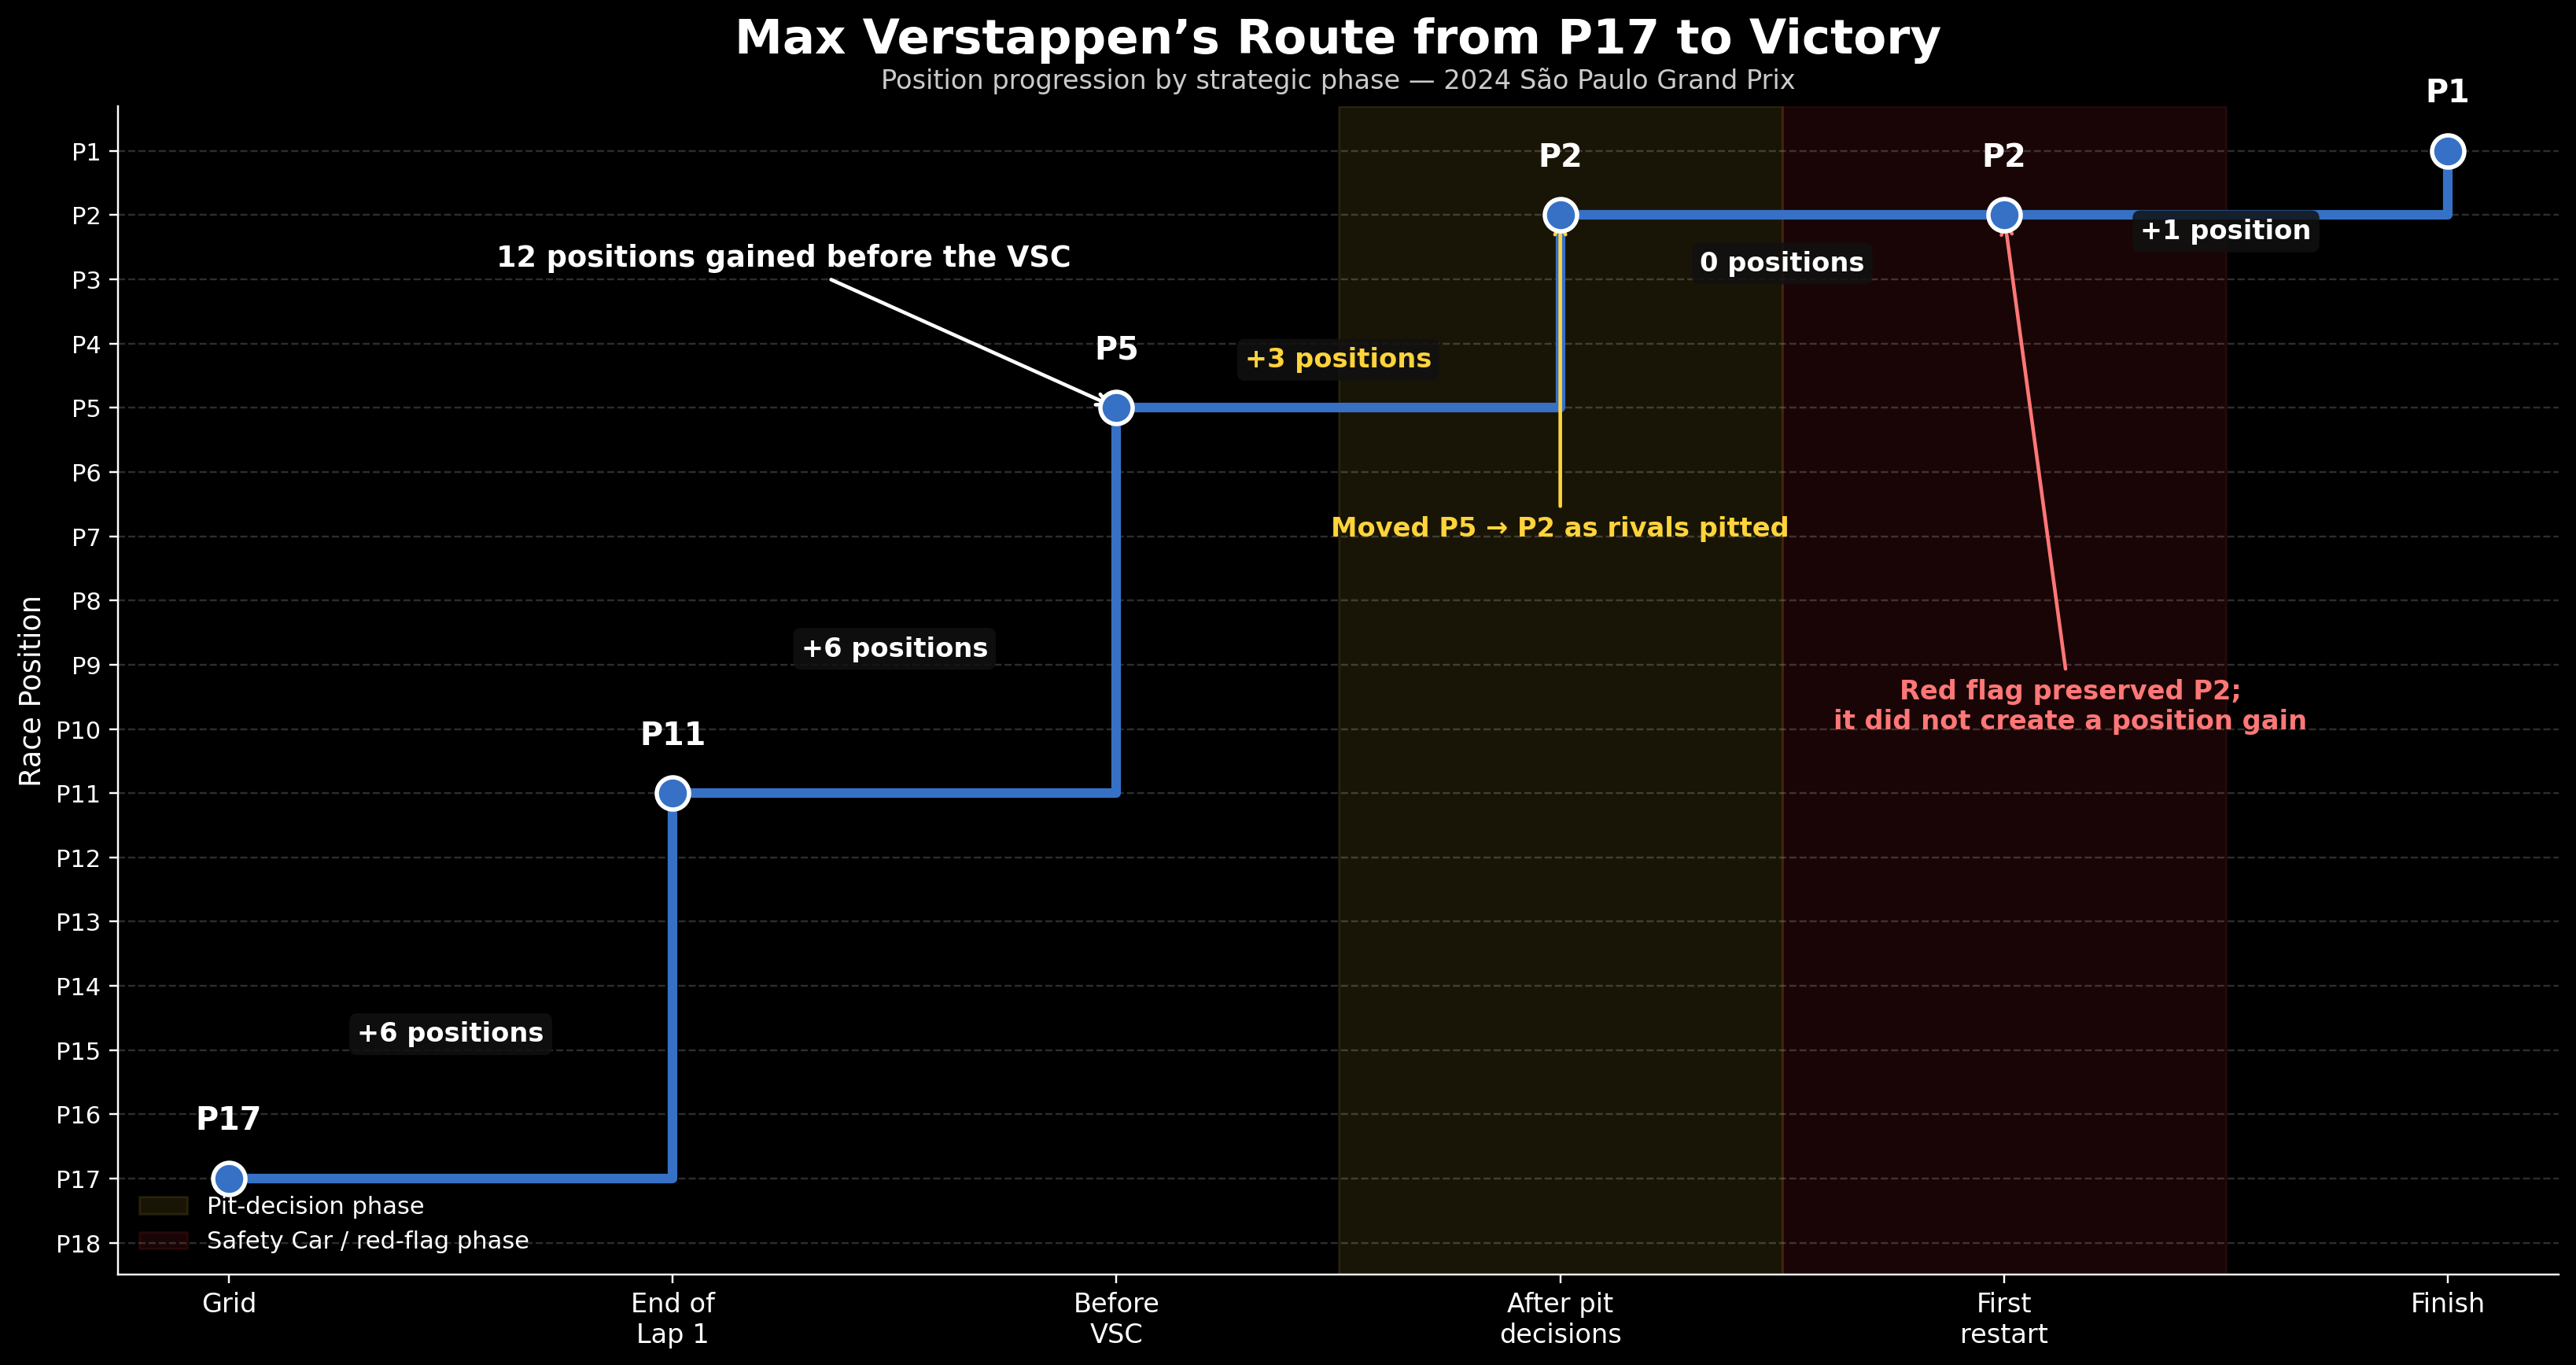
Breaking the recovery into strategic phases separates the positions Verstappen won on track from those
created by the pit split and the position he gained after the final restart.
01
+6 positions
Opening lap: P17 to P11.
02
+6 positions
Pre-VSC progress: P11 to P5.
03
+3 positions
Lap 28 pit decisions: P5 to P2.
04
0 positions
Safety Car and red flag: P2 remained P2.
05
+1 position
Post-restart phase: P2 to P1.
View full resolution
Verstappen gained twelve positions before the VSC, three as rivals stopped, none directly through the
red-flag sequence, and one after the final restart. Select the chart to inspect the full-resolution figure.
Red-flag counterfactual
What If the Stay-Out Drivers Had Pitted on Lap 28?
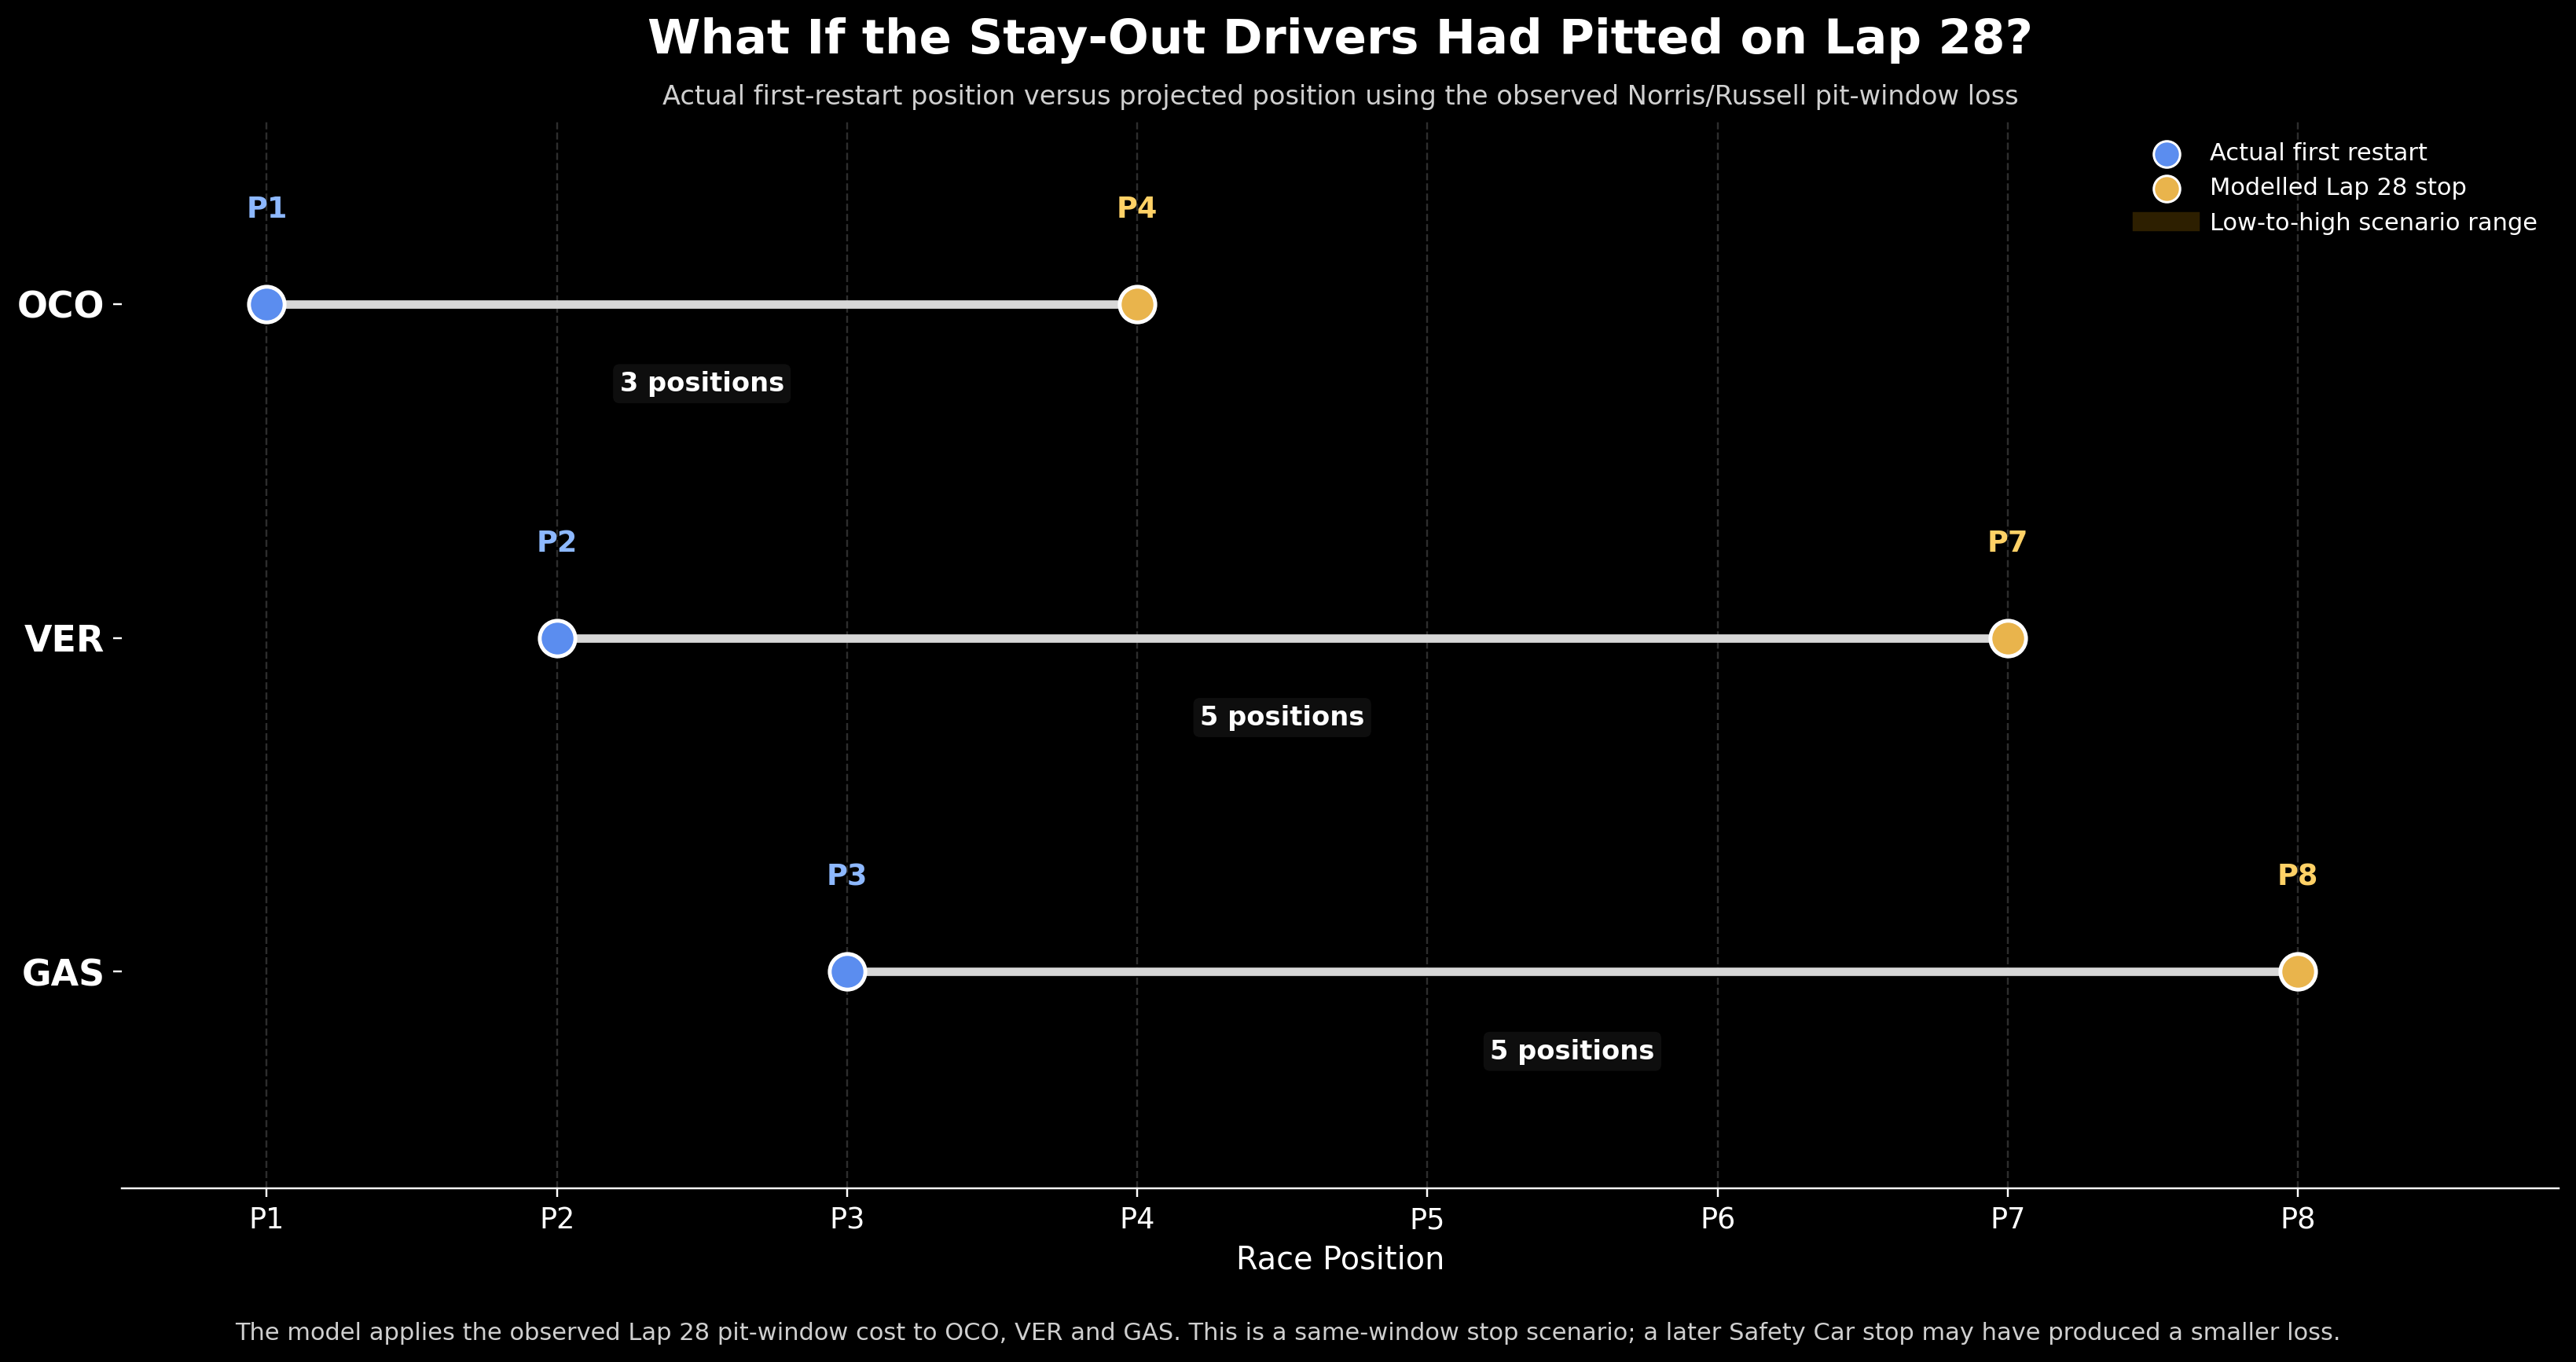
The scenario uses the observed Norris and Russell pit window to estimate where Ocon, Verstappen and Gasly
might have rejoined if they had also stopped at that moment.
01
Observe the pit window
Norris and Russell stopped during the Lap 28 window.
02
Estimate the loss
Their effective loss to non-stopping reference drivers was approximately 26 seconds.
03
Apply the scenario
The observed loss was applied to Ocon, Verstappen and Gasly.
04
Compare restart order
Projected positions were compared with the actual first-restart order.
Esteban Ocon
Actual P1 → modelled P4
Max Verstappen
Actual P2 → modelled P7
Pierre Gasly
Actual P3 → modelled P8
View full resolution
Actual first-restart positions compared with a same-window Lap 28 stop scenario. The model estimates
Verstappen around P7 rather than P2, but it does not simulate a later Safety Car stop or every possible
no-red-flag race path. Select the chart to inspect the full-resolution figure.
Post-restart pace
Strategy Created the Opportunity — Pace Converted It
The two green-flag phases tell different stories. Ocon was quicker immediately after the red flag, while
Verstappen established the decisive advantage only after the second restart.
First restart · Laps 34–38
Verstappen did not immediately dominate
Shared laps
5
Ocon’s average advantage
~0.52 s/lap
Ocon was faster across this short phase, so the first red flag did not immediately translate into
superior Verstappen pace.
Final green-flag phase · Laps 44–69
The race-winning pace emerged
Shared clean laps
26
Verstappen median lap time
81.934 seconds
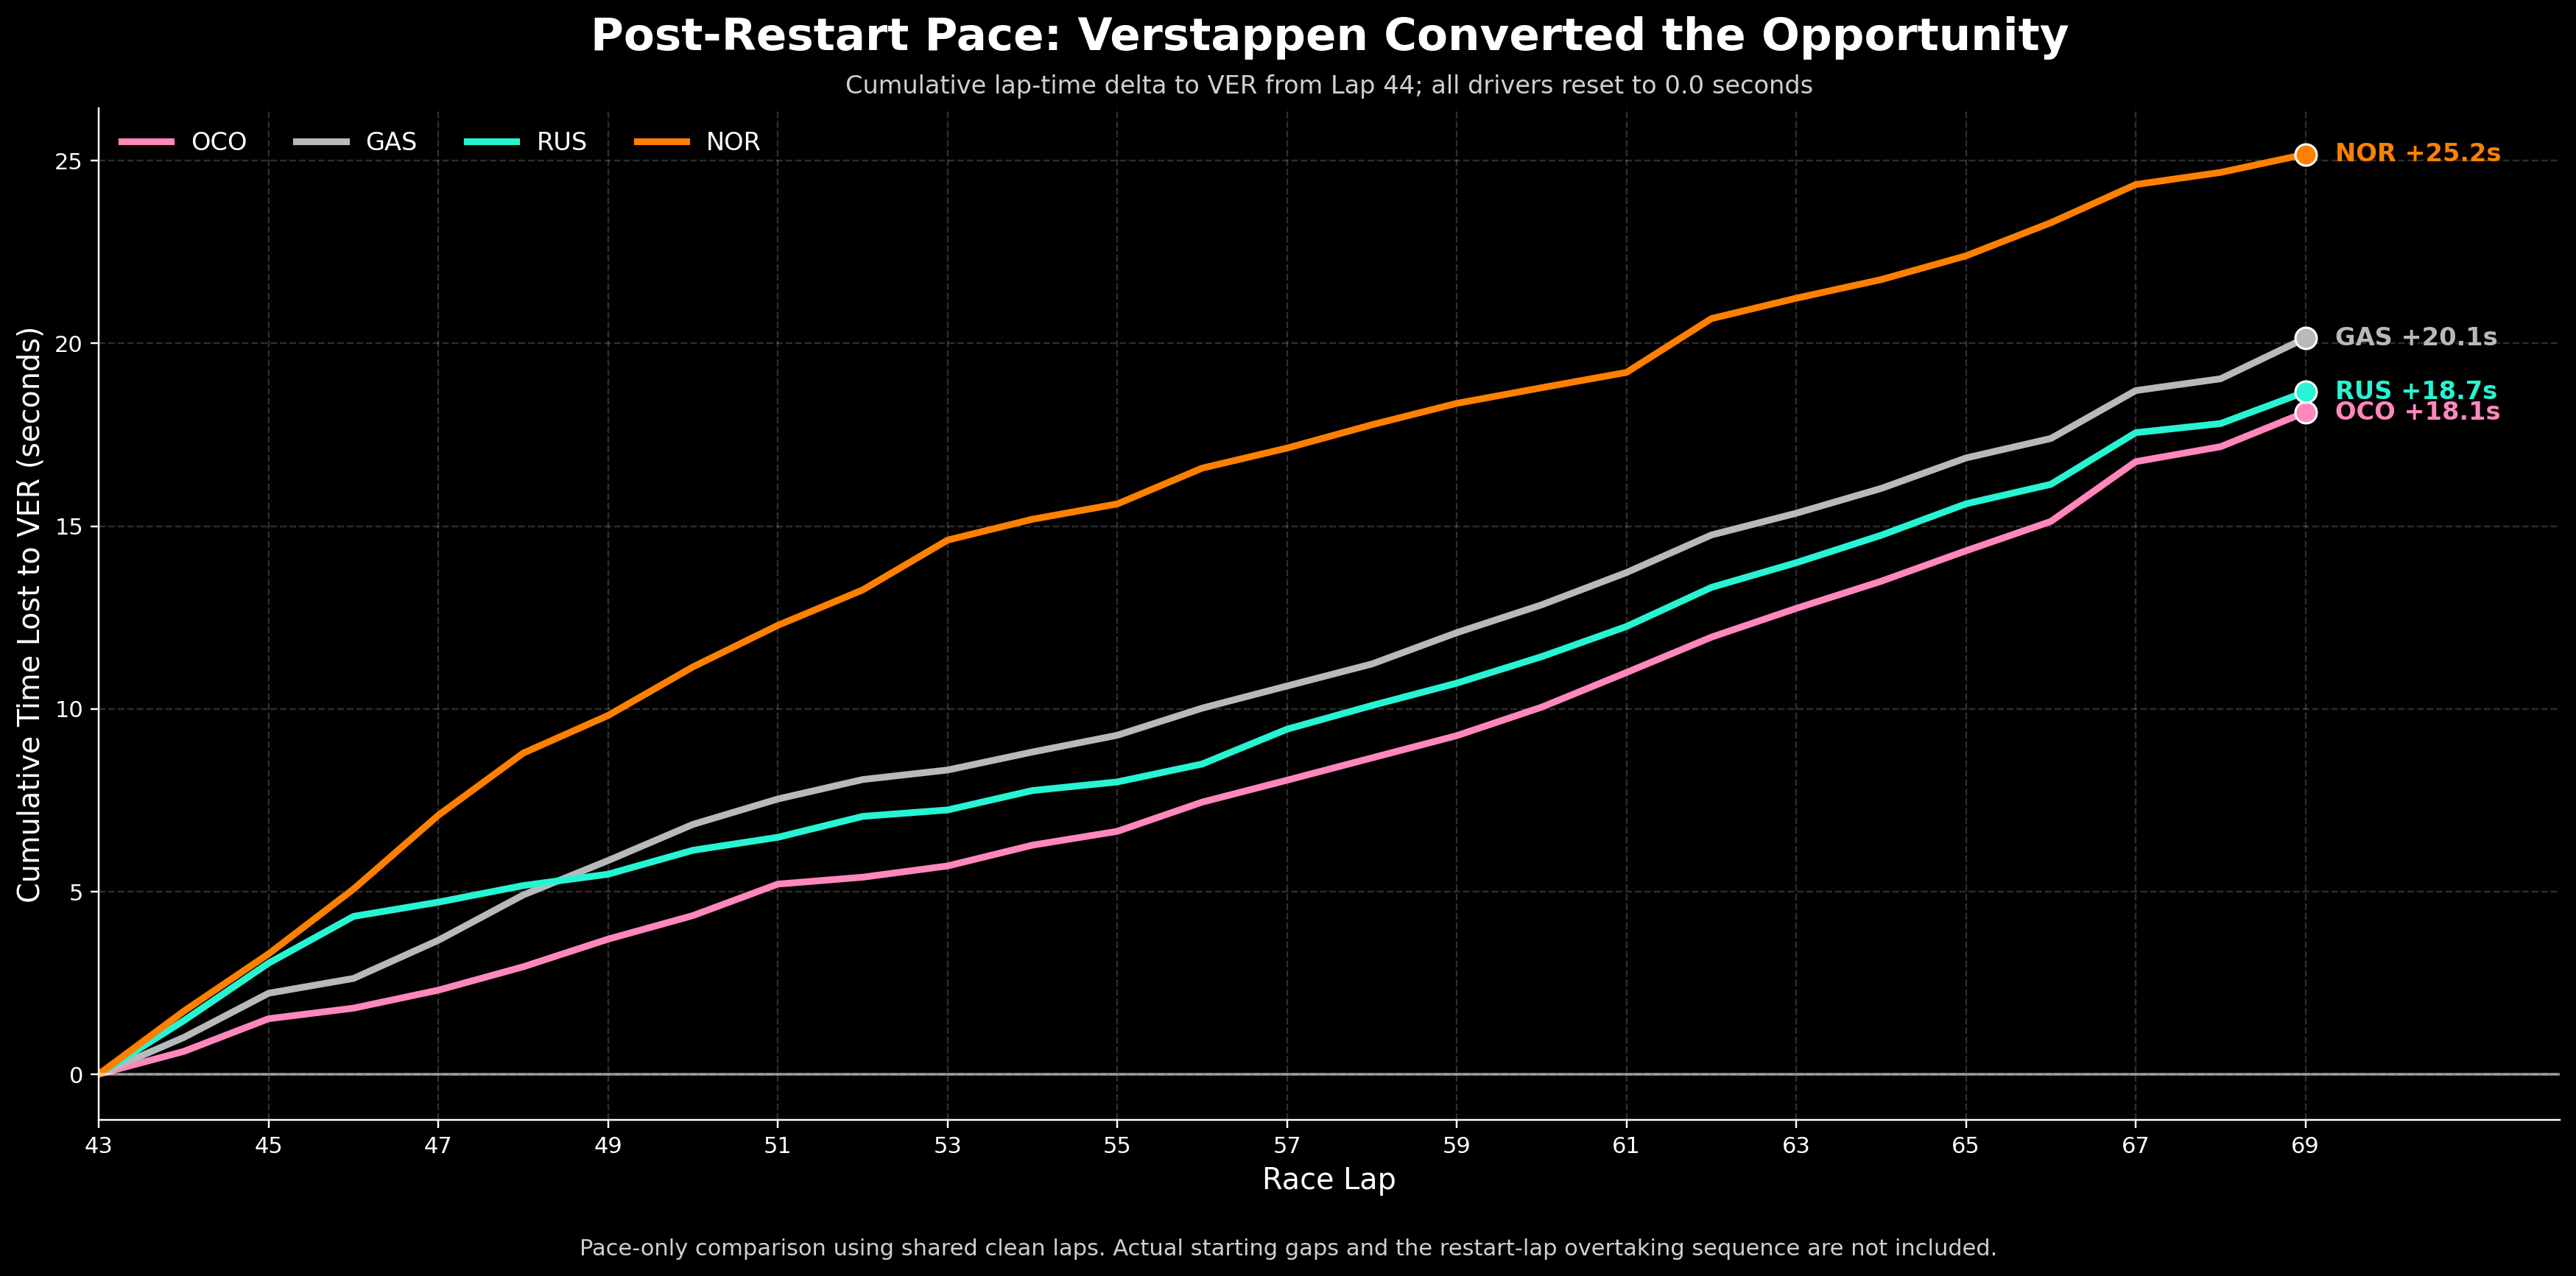
Across the final shared comparison window, every selected rival accumulated substantial time loss to
Verstappen.
Final-stint comparison
Ocon
Mean loss
+0.697 s/lap
Cumulative loss
+18.1 seconds
Russell
Mean loss
+0.718 s/lap
Cumulative loss
+18.7 seconds
Gasly
Mean loss
+0.775 s/lap
Cumulative loss
+20.1 seconds
Norris
Mean loss
+0.968 s/lap
Cumulative loss
+25.2 seconds
View full resolution
Pace-only comparison across 26 shared clean laps from Lap 44 to Lap 69. Every driver is reset to zero at
the beginning of the analysed stint, so the chart measures relative pace accumulation rather than actual
on-track gaps. Select the chart to inspect the full-resolution figure.
Verdict
Verstappen’s victory came from three distinct contributions
01
On-track recovery
He moved from P17 to P5 before the VSC, gaining twelve positions without relying on the decisive
strategic sequence.
02
Strategic positioning
The Lap 28 stops ahead moved Verstappen from P5 to P2. The red flag then let the stay-out group
replace its tyres without surrendering that position through a conventional stop.
03
Race conversion
After the second restart, Verstappen was approximately 0.70 to 0.97 seconds per lap faster than the
comparison drivers and turned the strategic opportunity into a decisive victory.
The red flag was materially beneficial, but it neither created Verstappen’s opening recovery nor
directly moved him from P5 to P2. Strategy placed him in a race-winning position; his final-stint pace
completed the win.
Transparency
Methodology and limitations
Data source
Public OpenF1 data for the 2024
São Paulo Grand Prix, including:
Lap timing and driver positions
Tyre stints and pit stops
Race-control messages
Session results
Methods
Lap-by-lap position reconstruction
Strategic checkpoint comparison
Position-gain decomposition
Same-window pit-loss counterfactual
Shared-lap post-restart pace comparison
Interpretive limits
The counterfactual does not simulate every Safety Car, tyre, traffic or restart outcome.
The modelled P7 assumes a Lap 28 stop comparable to Norris and Russell.
A later stop under the Safety Car may have cost fewer positions.
The cumulative pace chart resets drivers to zero and excludes actual starting gaps.
Public timing data cannot fully represent team information, driver confidence, visibility or
real-time forecasts.