France 2021: When Did Verstappen’s Second Stop Become the Winning Strategy?
Red Bull surrendered the lead by stopping Max Verstappen for a second time on Lap 32. By the end of Lap 33,
he was more than 18 seconds behind Lewis Hamilton, but had a substantial offset in tyre compound and age for
the final 20 laps. This study reconstructs the required catch rate and tests the principal alternatives.
Independent analysis using publicly available data. Not affiliated with Formula 1 or any Formula 1 team.
Two-stop strategy
Tyre degradation
Catch-rate analysis
Counterfactual analysis
Strategic context
The first stop won the lead; the second gave it back
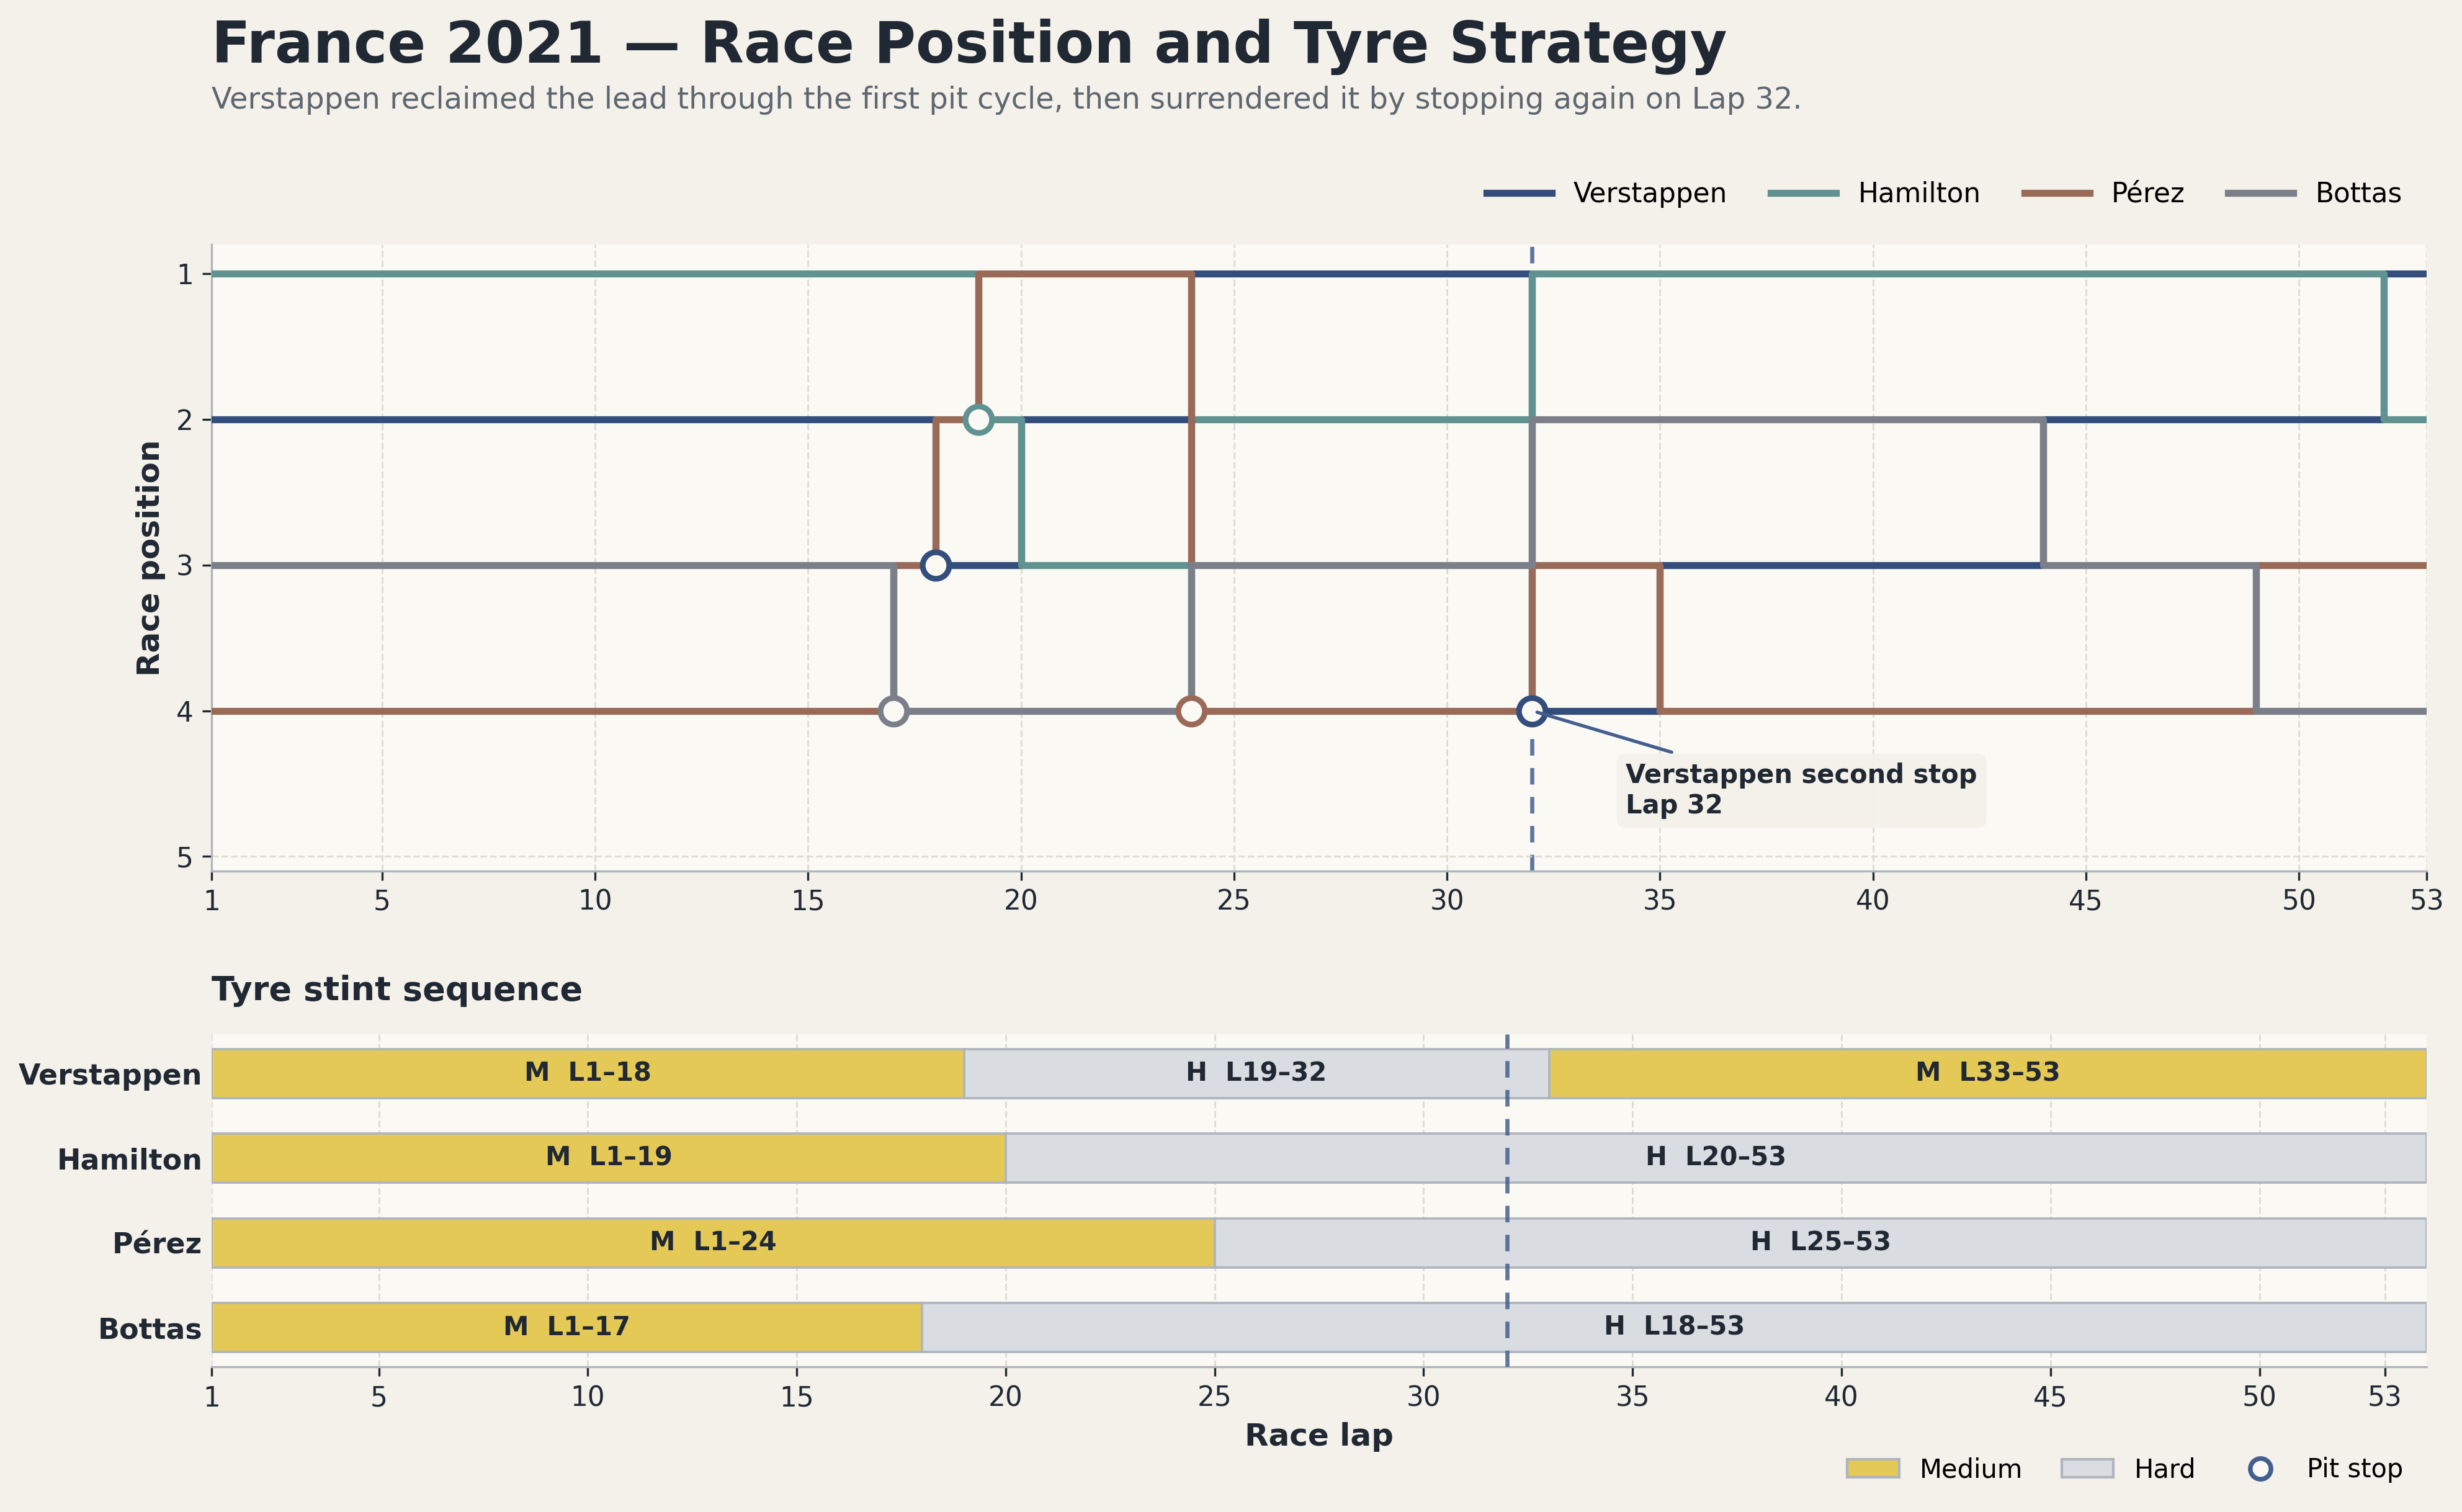
Verstappen, Hamilton, Sergio Pérez and Valtteri Bottas began on used medium tyres. Bottas stopped on Lap 17.
Verstappen stopped on Lap 18 and undercut Hamilton; Hamilton responded on Lap 19. Verstappen led on hard tyres
before Red Bull stopped him again on Lap 32 for another set of used medium tyres. Hamilton kept his hard tyres
to the finish; Verstappen regained the lead on Lap 52 and won.
Race startFour leading drivers start on used medium tyres
Lap 17Bottas makes the first stop
Lap 18Verstappen stops and undercuts Hamilton
Lap 19Hamilton responds
Lap 32Verstappen makes his second stop
Lap 52Verstappen regains the lead
View full resolution
The opening pit cycle put Verstappen ahead, but the Lap 32 stop traded that track position for a large
late-race tyre offset. Select the chart to inspect the full-resolution figure.
The second-stop break-even
Could Verstappen repay the second stop?
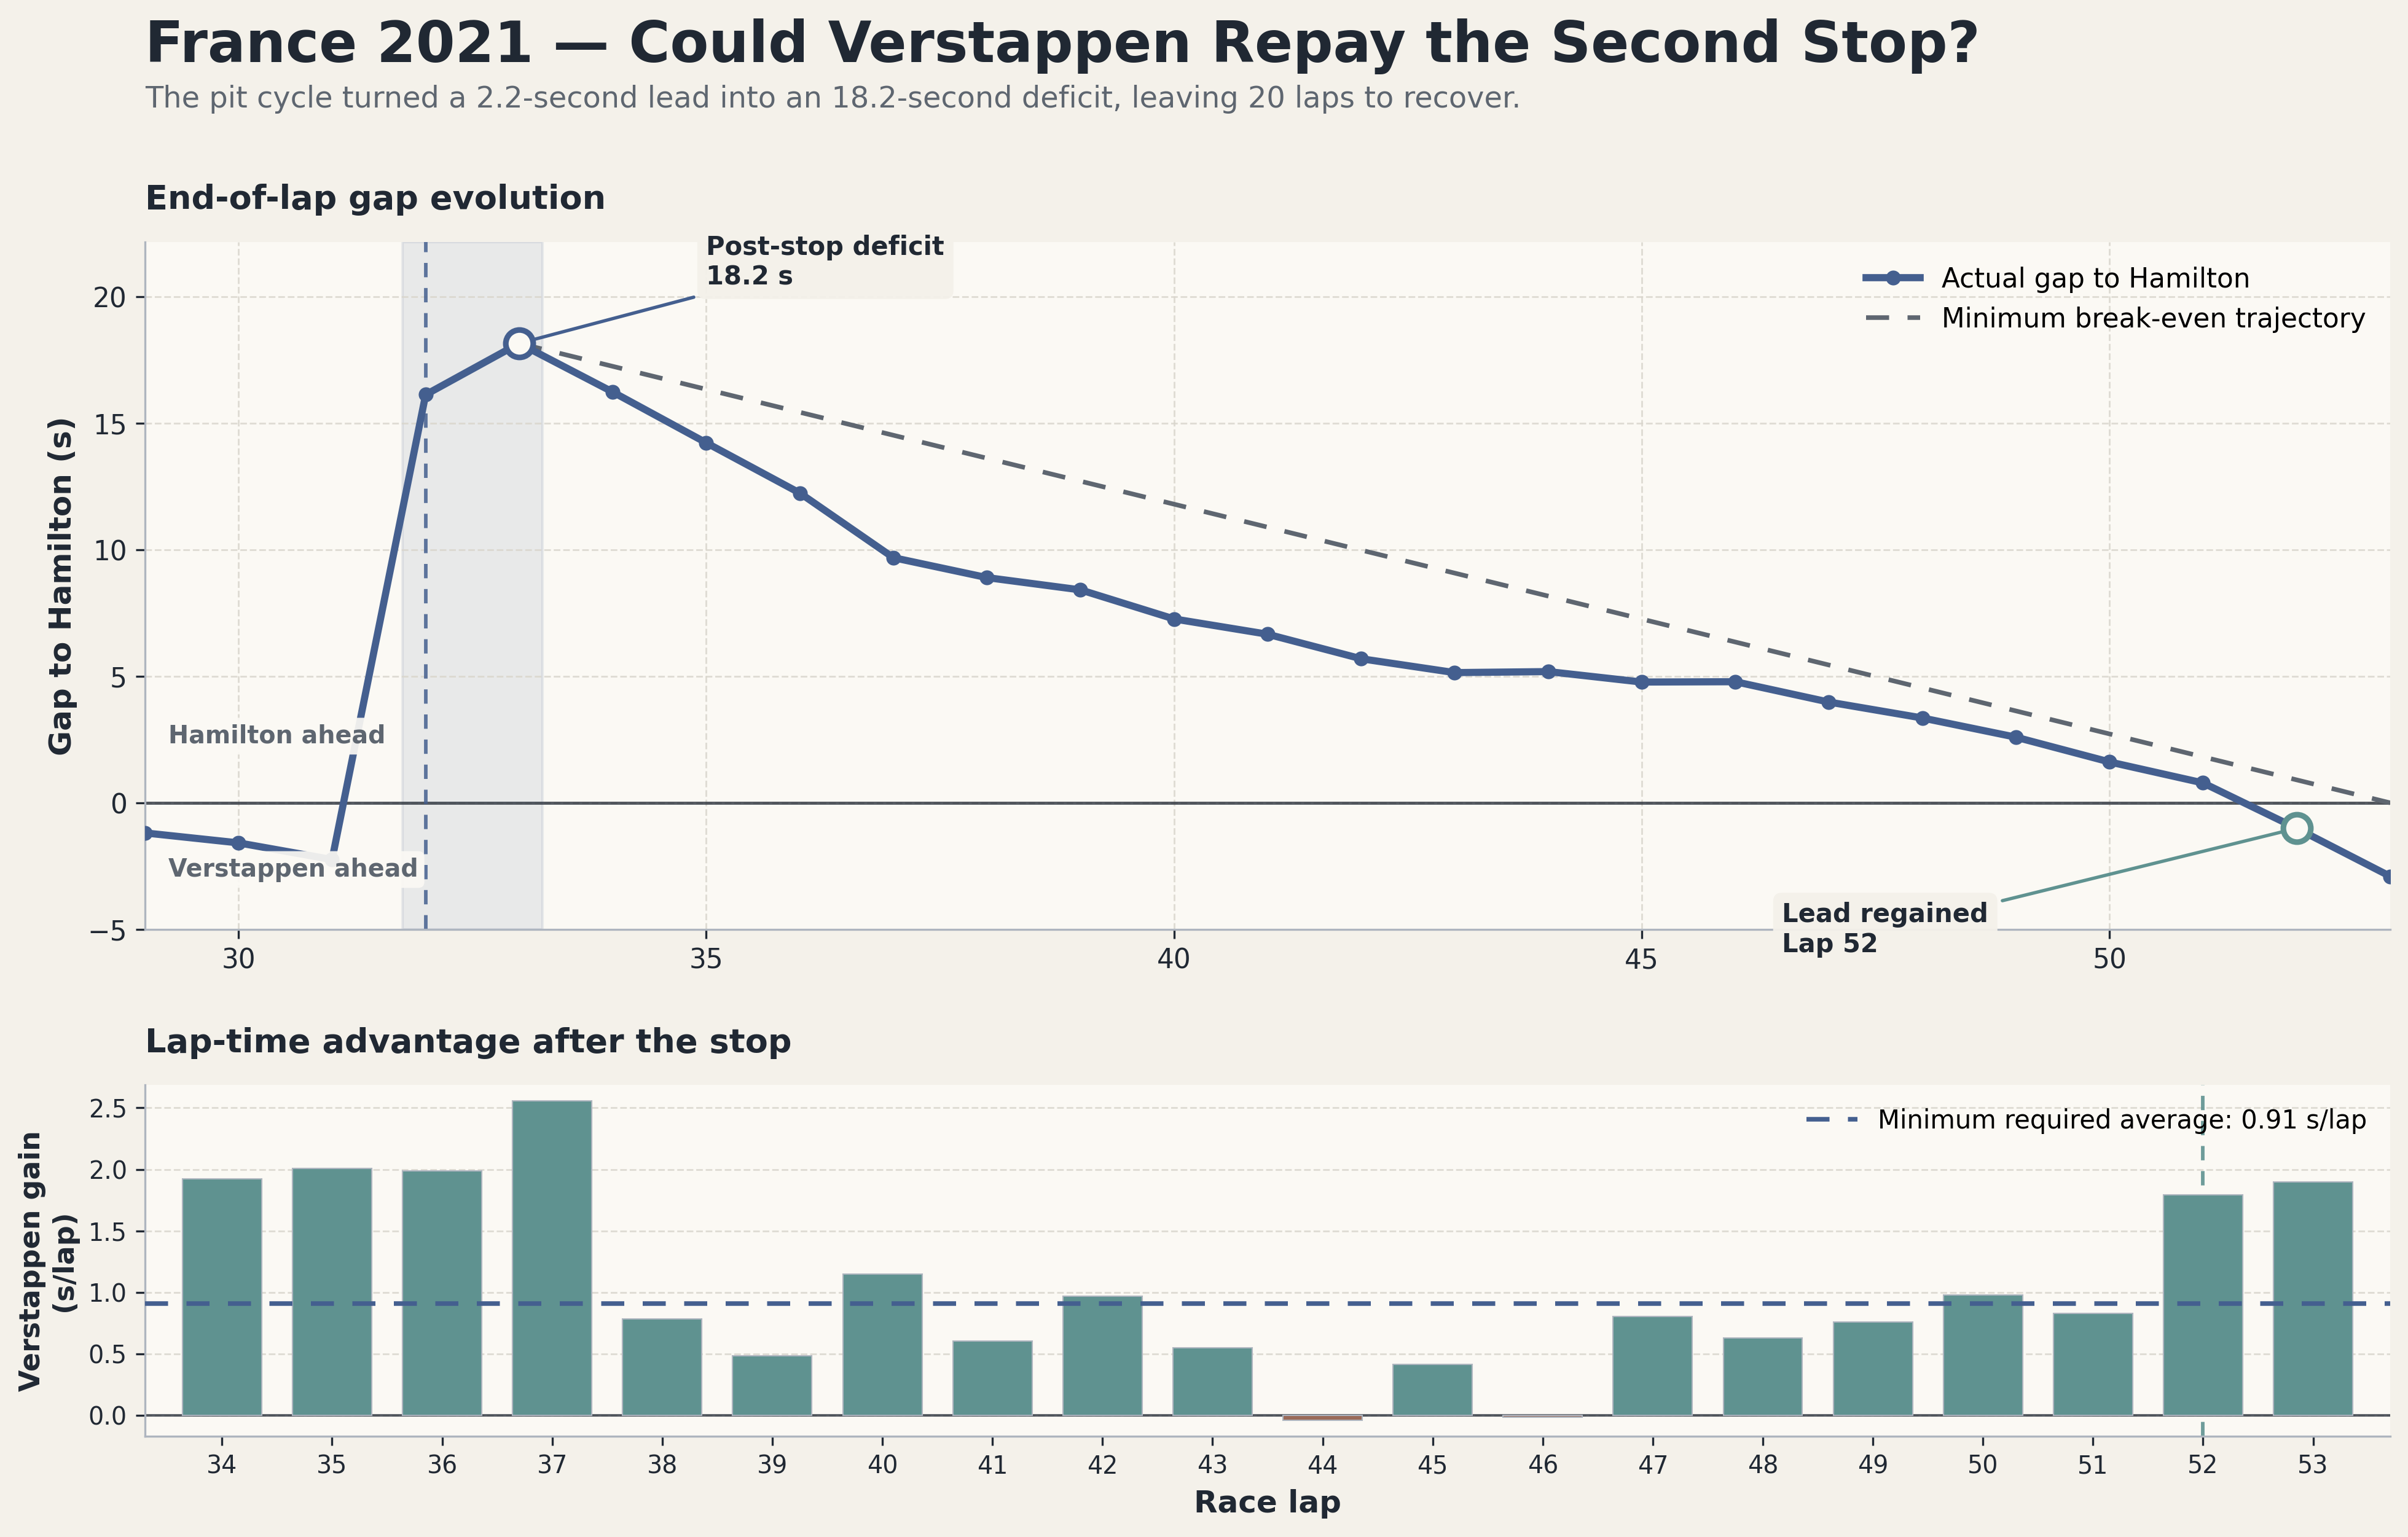
The measured pit cycle turned a 2.241-second lead at the end of Lap 31 into an 18.160-second deficit at the
end of Lap 33. With 20 laps remaining, Verstappen needed an average gap-closure rate of approximately
0.91 seconds per lap to draw level by the finish.
End of Lap 31
2.241 s aheadTrack position before the second-stop cycle.
End of Lap 33
18.160 s behindMeasured deficit after the pit cycle.
Relative pit-cycle swing
20.401 sIncludes the relative performance around the stop.
Minimum gap-closure rate
~0.91 s/lapRequired across the 20 remaining laps.
View full resolution
The stop created a demanding but achievable target. Verstappen recovered faster than the minimum break-even
trajectory from the start of the chase and regained the race lead on Lap 52. Select the chart to
inspect the full-resolution figure.
Tyre-offset pace
How the tyre offset powered the chase
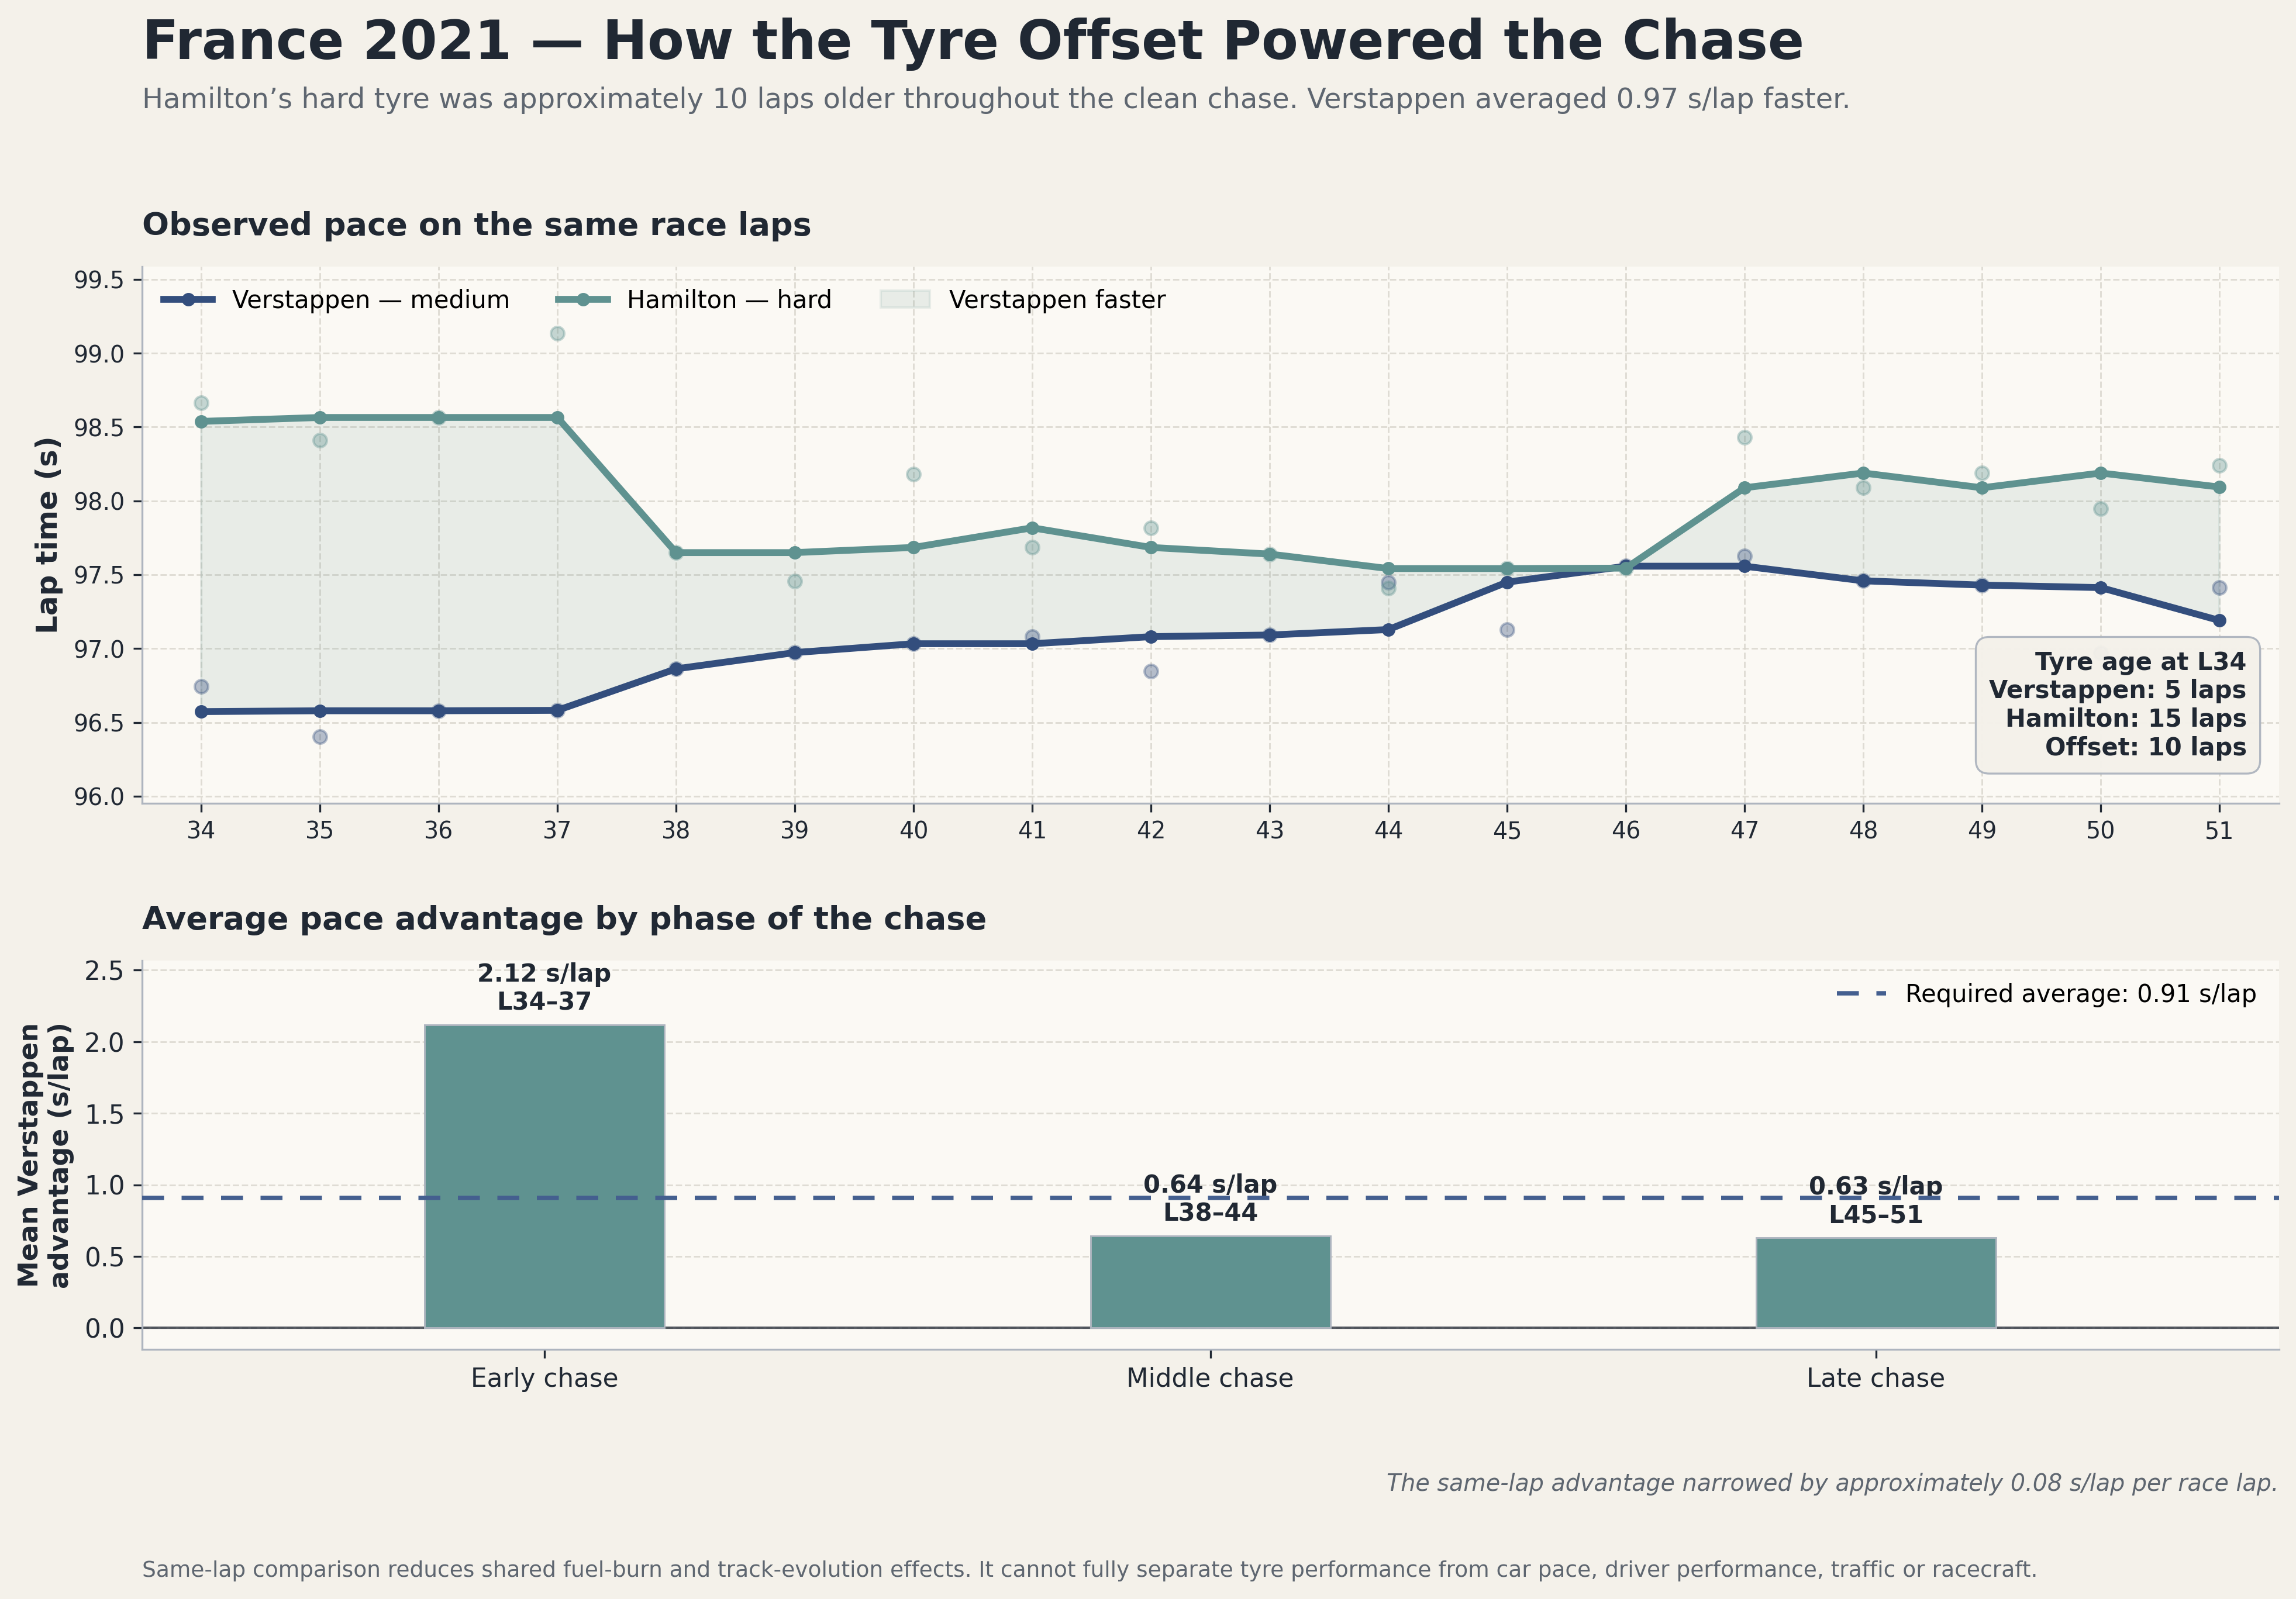
Across the same-lap comparison window from Laps 34–51, Verstappen averaged approximately 0.97 seconds per
lap faster than Hamilton. The largest share of that measured advantage arrived in the first four laps; the
advantage narrowed later but remained positive.
Observed phase averages
Full chase
Window
Laps 34–51
Mean advantage
~0.97 s/lap
Early chase
Window
Laps 34–37
Mean advantage
~2.12 s/lap
Middle chase
Window
Laps 38–44
Mean advantage
~0.64 s/lap
Late chase
Window
Laps 45–51
Mean advantage
~0.63 s/lap
View full resolution
The early chase accounted for the largest share of the observed gap reduction. The same-lap advantage then
narrowed as the chase progressed but remained sufficient to keep closing. Select the chart to inspect the
full-resolution figure.
Supporting counterfactual
Could Mercedes have covered the stop?
Applying Verstappen’s observed 20.401-second relative pit-cycle swing symmetrically to Hamilton suggests
that an immediate Lap 33 response would have placed Hamilton approximately 2.241 seconds behind Verstappen.
Over the remaining 20 laps, Hamilton would then have needed to close roughly 0.112 seconds per lap to draw
level by the finish.
Modelled rejoin
Hamilton ~2.241 s behind
Nominal closure threshold
~0.112 s/lap
Opening-stint same-compound median
Hamilton ~0.080 s/lap faster
One-stop sensitivity
Did Verstappen need the second stop?
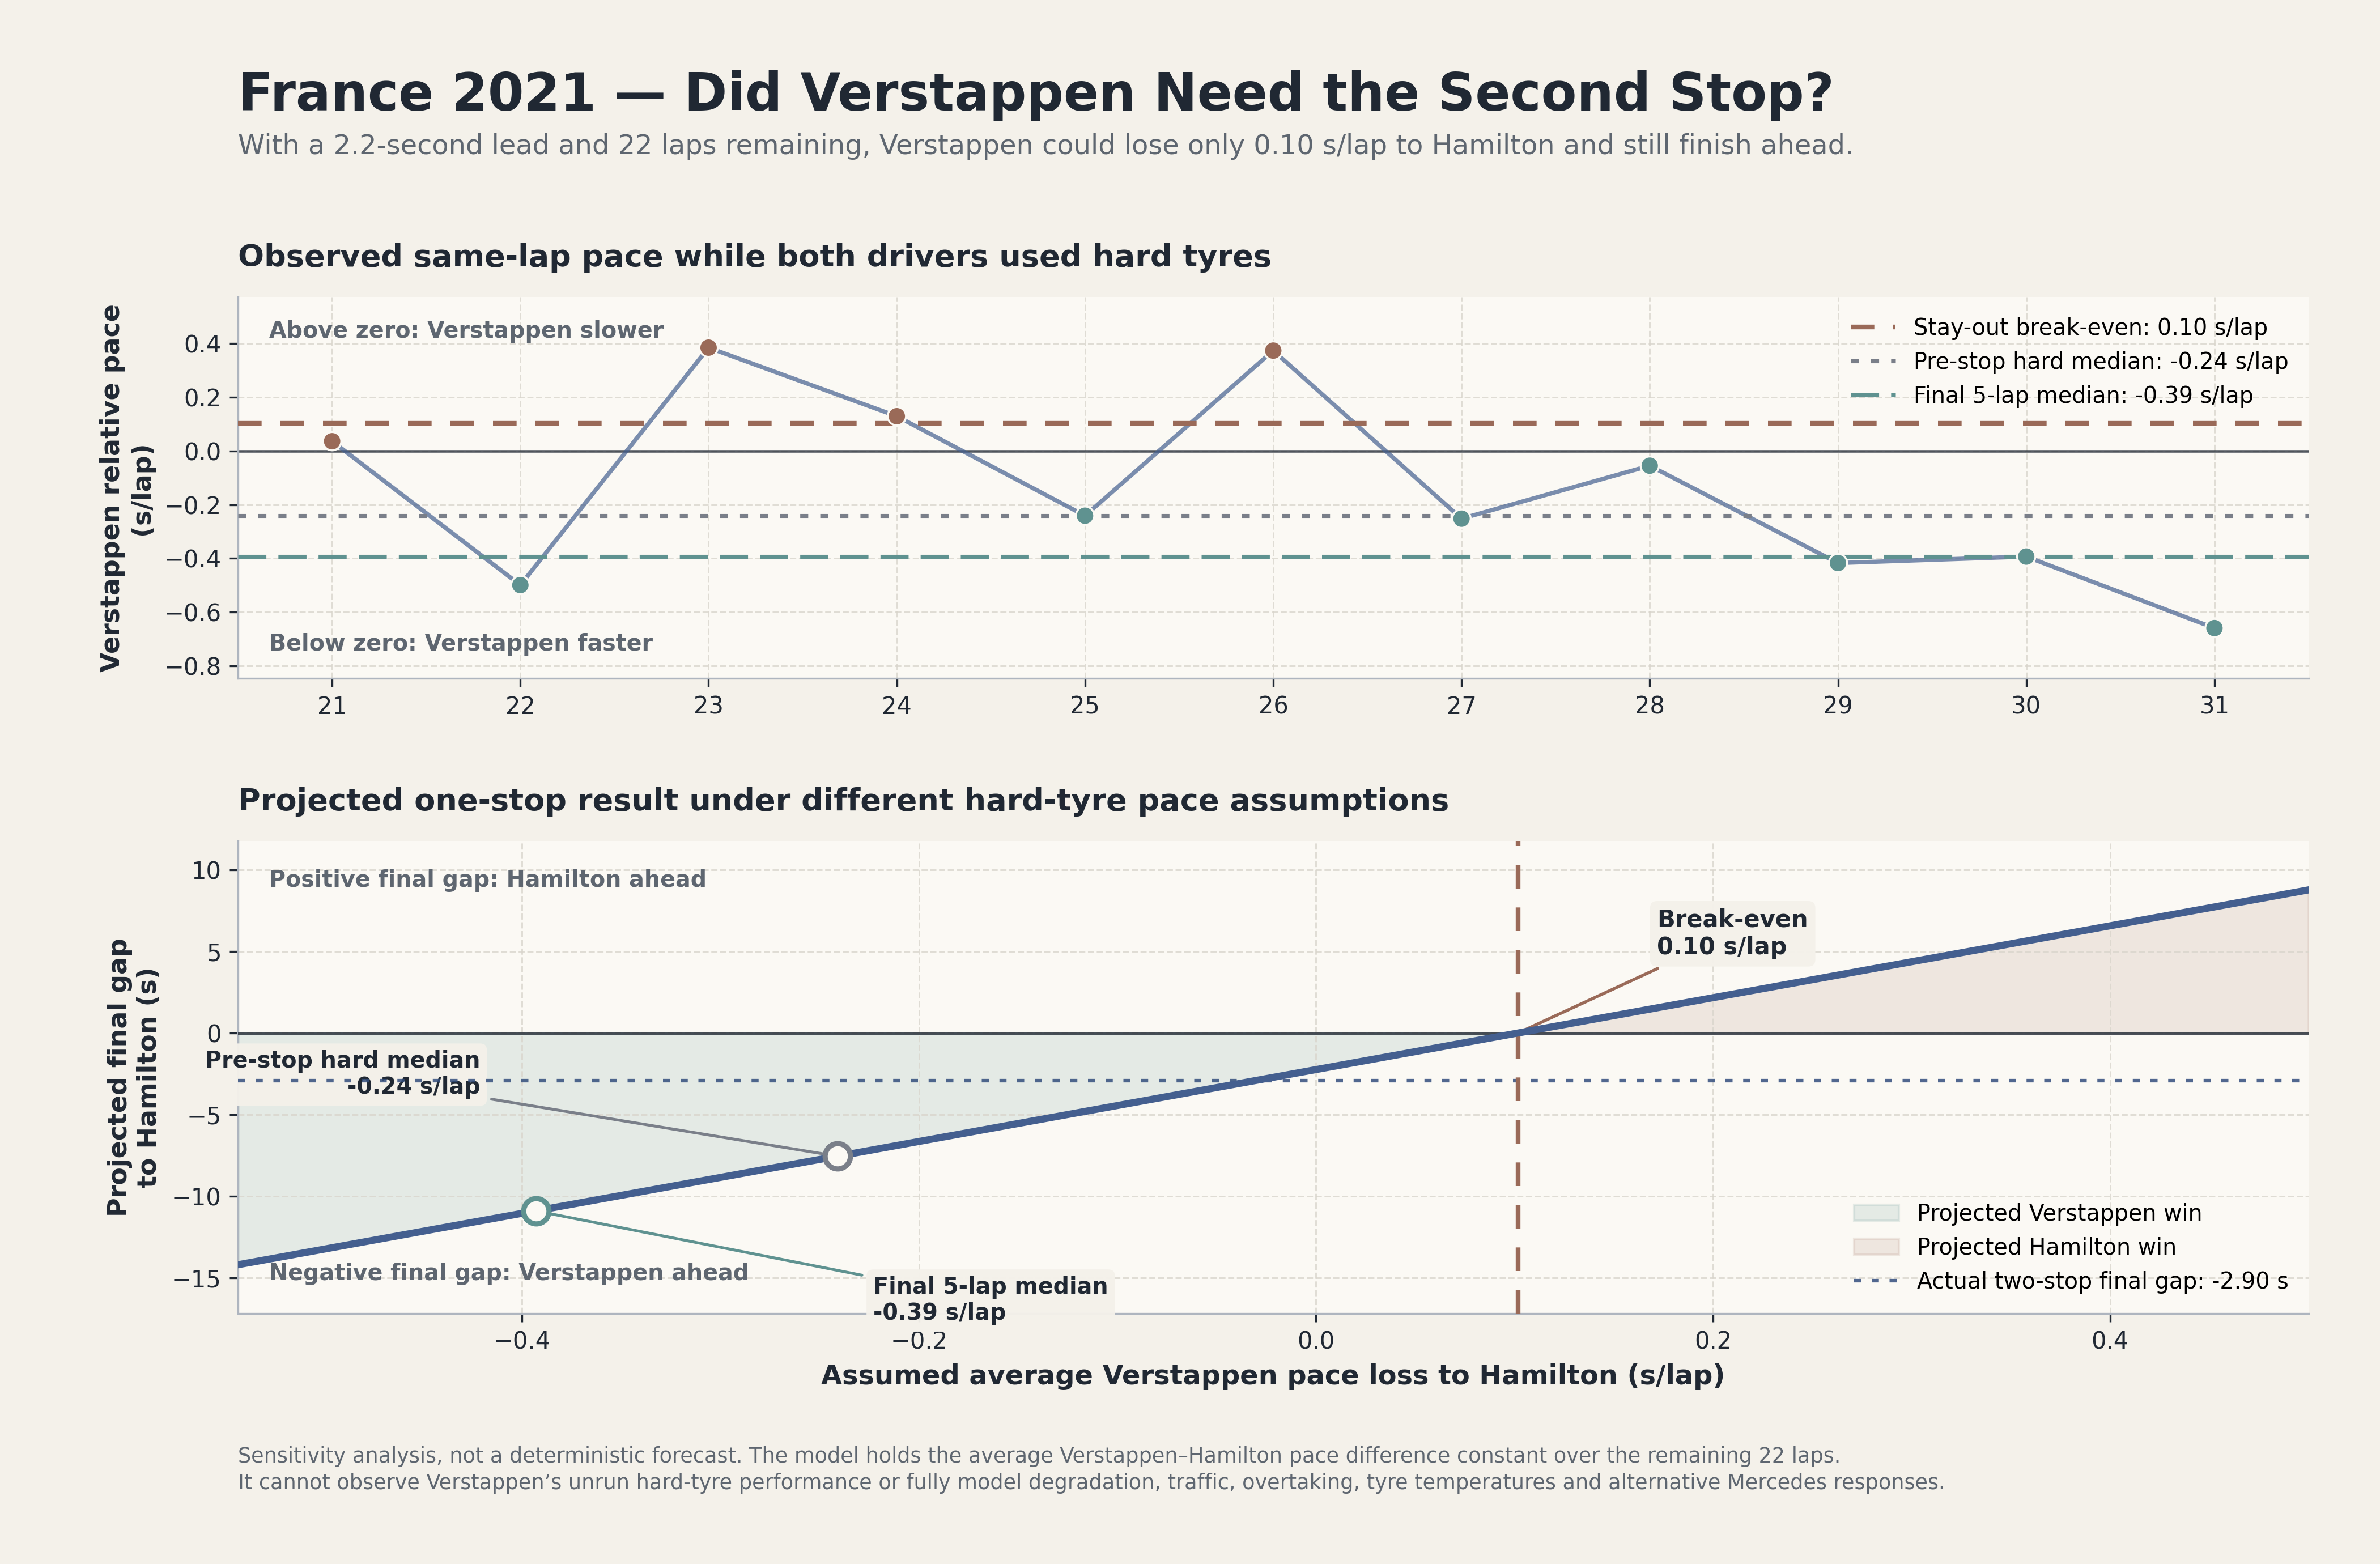
At the end of Lap 31, Verstappen led by 2.241 seconds with 22 laps remaining. An average relative pace loss
below approximately 0.102 seconds per lap would therefore have left him ahead at the finish under a
constant-pace projection.
Race constraint
How much pace could the lead absorb?
Lead after Lap 31
2.241 seconds
Laps remaining
22
Break-even pace loss
~0.102 s/lap
Observed pre-stop evidence
The hard-tyre pace was still competitive
Matched-lap hard-tyre median
~0.24 s/lap faster
Final five matched laps
~0.39 s/lap faster
Both comparisons express Verstappen’s pace relative to Hamilton’s before the second stop.
View full resolution
When extrapolated as constant-pace assumptions, both pre-stop comparisons fall below the break-even
threshold and project a Verstappen win. They do not reveal how his hard tyres would have performed for
another 22 laps. Select the chart to inspect the full-resolution figure.
Final assessment
Successful, but not proven to be the only winning route
Red Bull’s second stop was aggressive and ultimately successful. It created a large offset in tyre compound
and age.
After the stop, Verstappen erased an 18.2-second deficit and regained the lead on Lap 52. The public evidence
does not, however, establish that it was the only viable winning strategy. His pre-stop hard-tyre pace
suggests the one-stop may also have remained competitive under several tested pace assumptions, but
degradation over the unrun laps, tyre temperatures, traffic and defensive racing cannot be reconstructed reliably.
Evidence supports
What the public data establishes
The second stop created a large, measurable offset in tyre compound and age.
Verstappen exceeded the required gap-closure rate.
The early chase accounted for the largest share of the observed gap reduction.
Verstappen completed the recovery and won after the second stop.
Evidence cannot prove
What remains counterfactual
That staying out would certainly have lost the race.
That a hypothetical Hamilton second stop would certainly have failed.
That tyre age alone caused the observed pace difference.
That Verstappen’s hard tyres would have degraded at a particular rate.
Transparency
Methodology and limitations
Data and gap reconstruction
Public FastF1 timing data
End-of-lap timing gaps
FastF1 laps flagged as accurate and run under green-flag conditions
Pace and scenario treatment
Lap 1, pit-in and pit-out laps, deleted laps and extreme timing anomalies excluded from pace summaries
Same-lap comparisons to reduce shared fuel-burn and track-evolution effects
Sensitivity analysis rather than deterministic prediction
Interpretive limits
Verstappen’s hard-tyre performance over the unrun laps cannot be observed directly.
Public data does not fully reveal tyre-set availability.
Traffic and overtaking are not fully modelled.
Car pace, driver execution and tyre condition are intertwined.
Counterfactual pit-cycle costs depend on simplifying assumptions.