Singapore 2023: Stop for Fresh Mediums or Stay on Hards?
Mercedes surrendered track position under the late Virtual Safety Car to put George Russell and Lewis
Hamilton on fresh medium tyres. This study tests whether the available pace justified that decision—and why
catching the leaders did not lead to victory.
Independent analysis using publicly available data. Not affiliated with Formula 1 or any Formula 1 team.
Tyre strategy
Virtual Safety Car
Break-even analysis
DRS defence
The decision
Trade track position for fresh-medium pace?
The central question is whether Mercedes was correct to surrender track position during the late Virtual
Safety Car for fresh medium tyres while Carlos Sainz and Lando Norris stayed out on used hard tyres. The tyre
decision is the main subject; the Sainz–Norris DRS arrangement is supporting evidence for why Mercedes caught
the leaders but did not pass them.
01
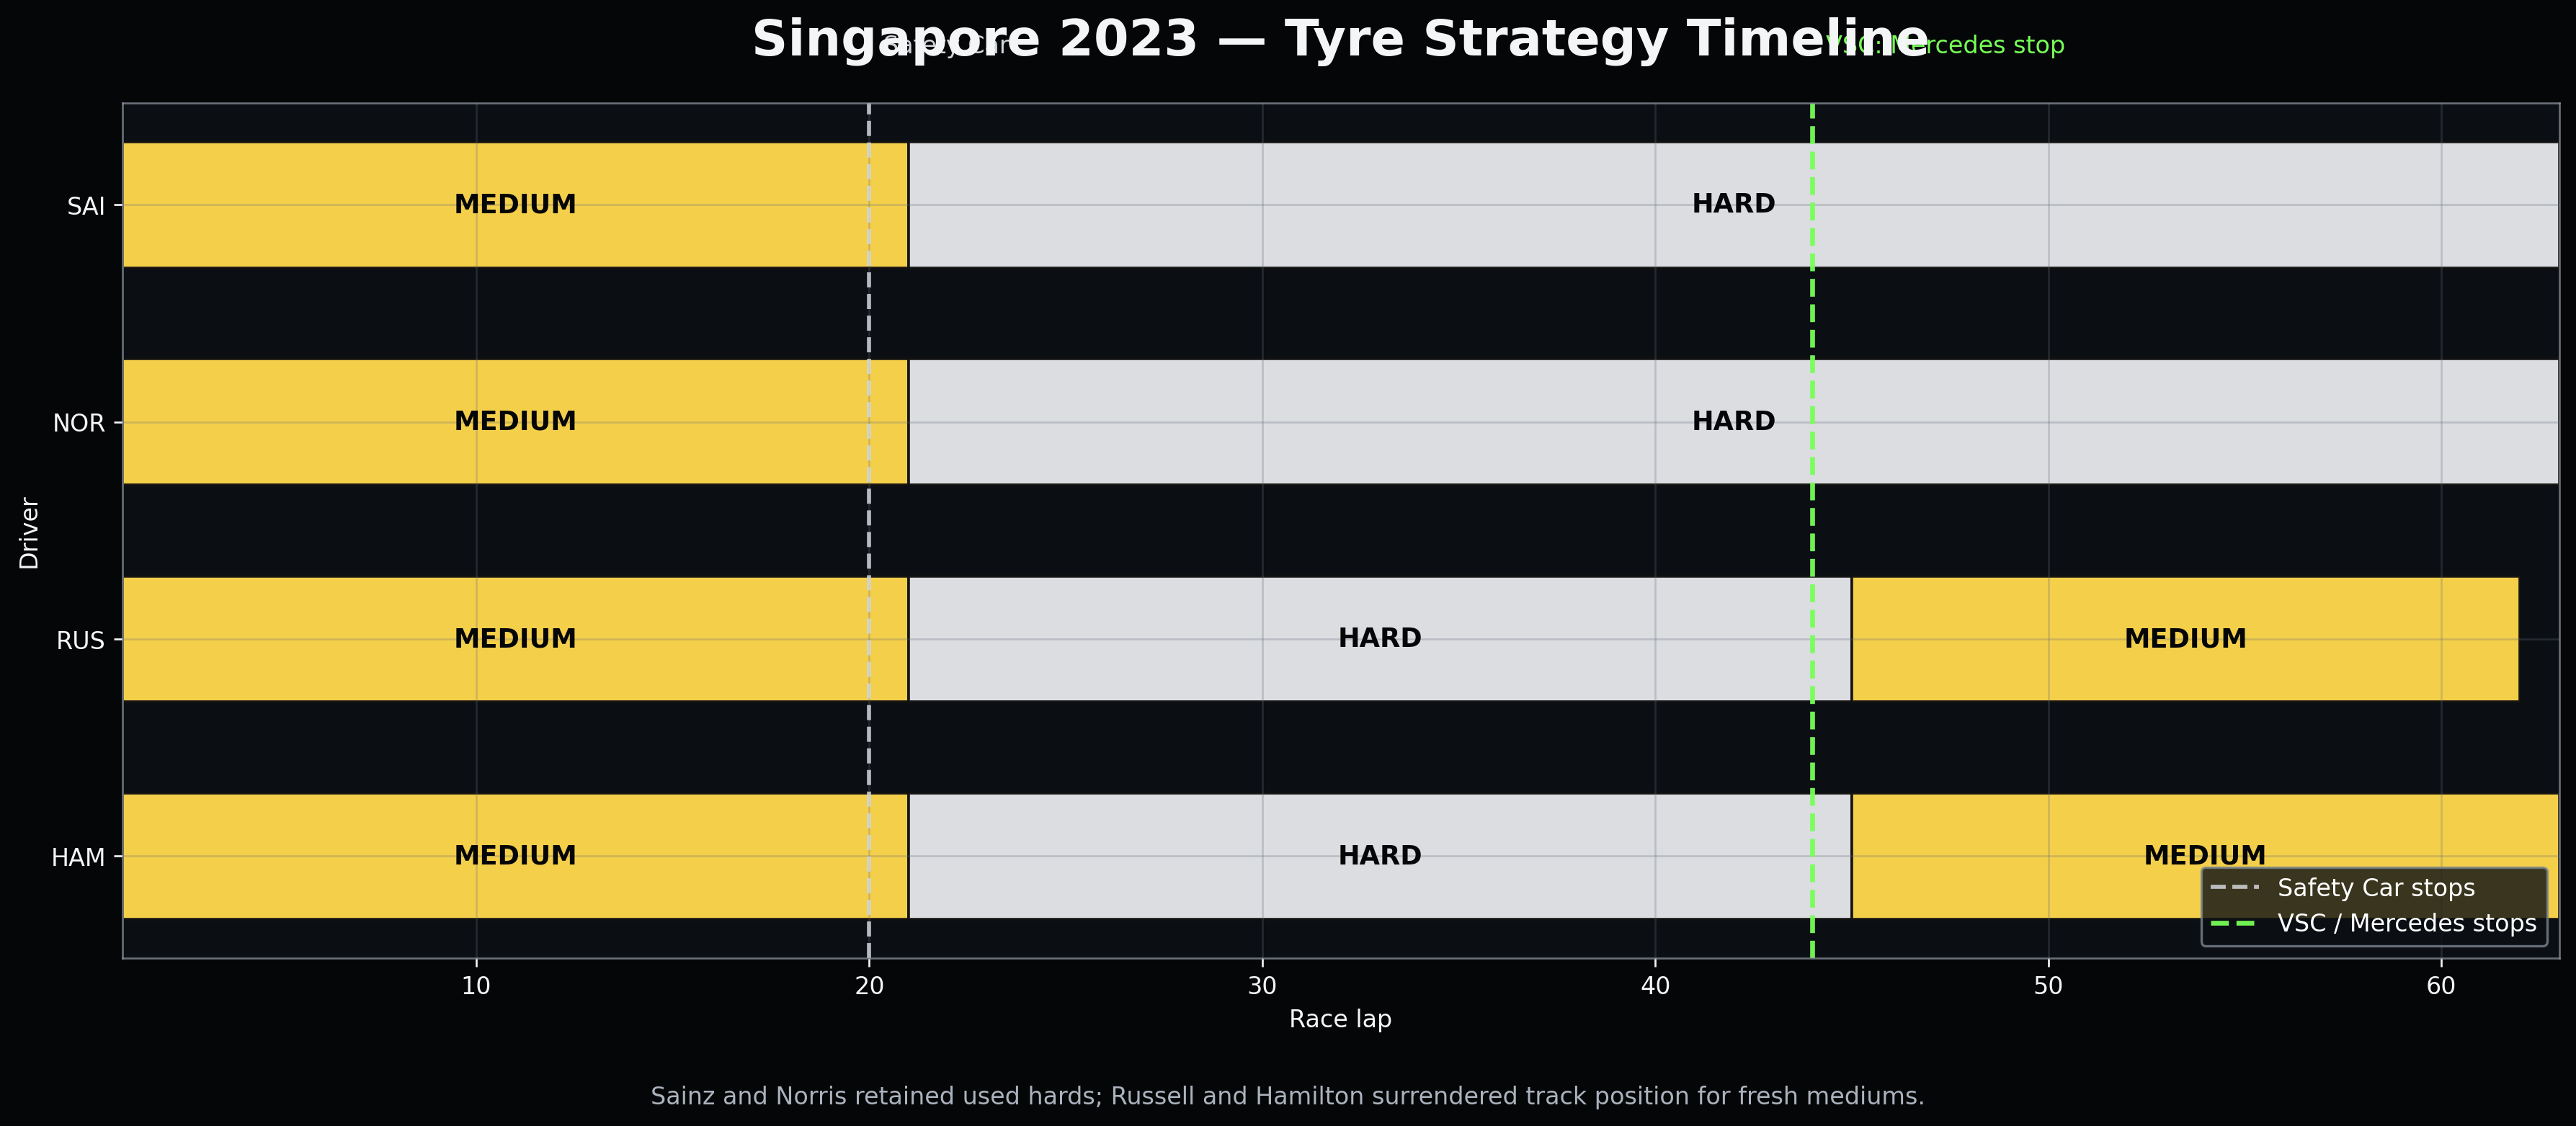
Lap-20 Safety Car
Sainz and Norris stopped for hard tyres, then remained on that set to the finish.
02
Mercedes follows the same opening path
Russell and Hamilton also stopped on lap 20 and fitted hard tyres.
03
Lap-44 Virtual Safety Car
Mercedes stopped both drivers again, exchanging track position for fresh medium tyres.
04
The strategic split
Russell and Hamilton gained a substantial tyre-life and compound advantage, but first had to recover
the time lost in the VSC stops.
View full resolution
The late VSC divided the leading group: Sainz and Norris protected track position on used hards, while
Mercedes committed both cars to fresh mediums. Select the chart to inspect the full-resolution figure.
The break-even test
Did the fresh-medium advantage justify the stop cost?
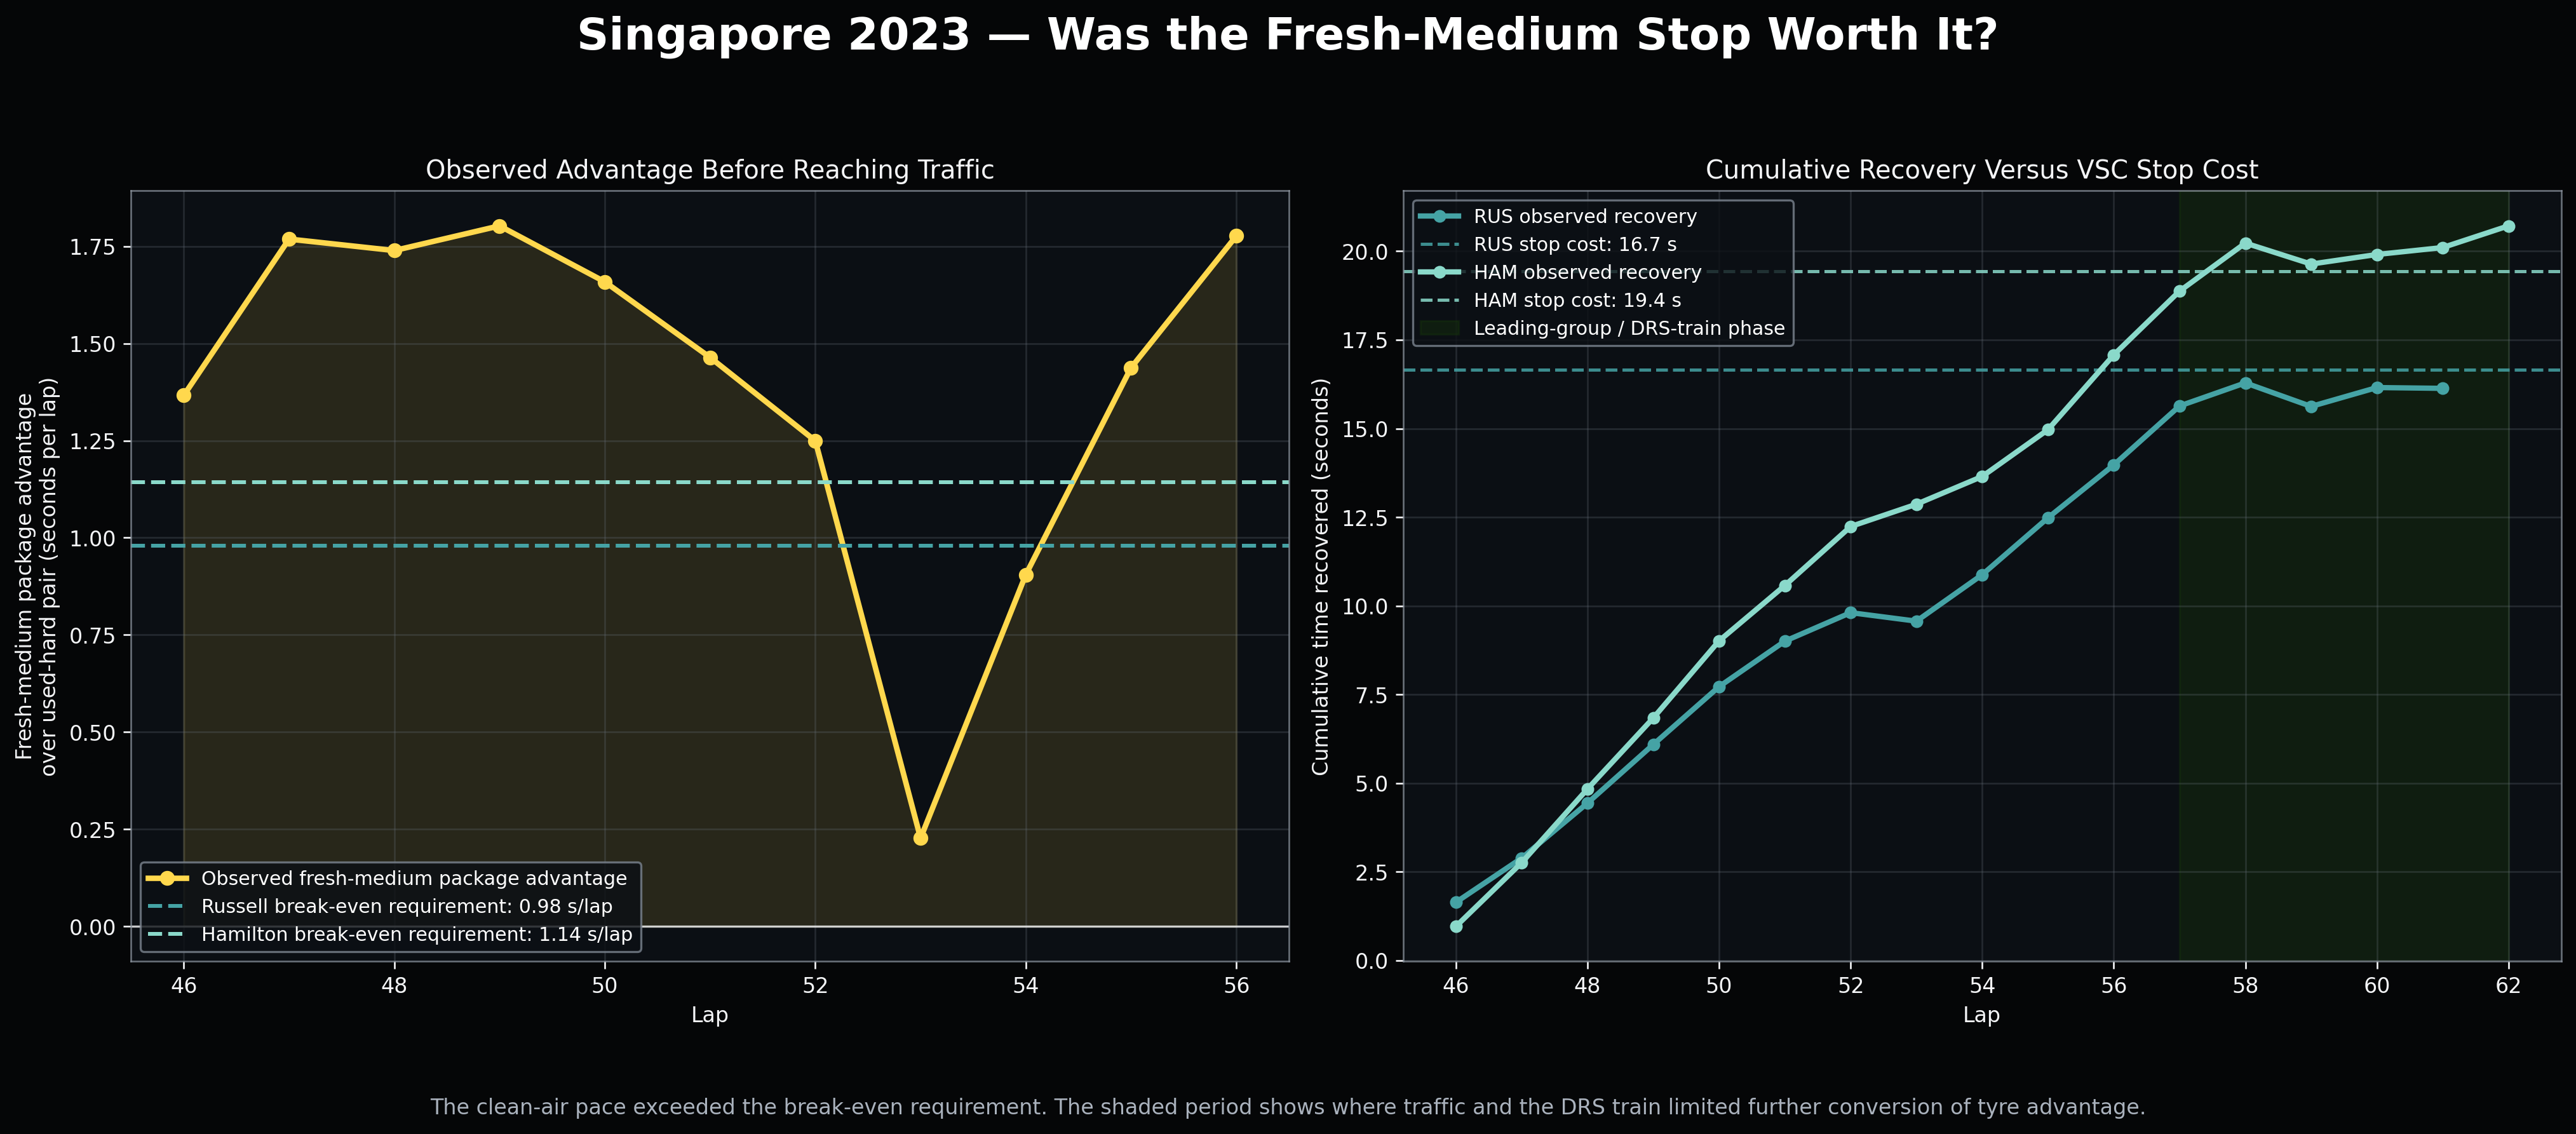
The decision can be tested by comparing each driver’s measured VSC stop cost with the average recovery
required over the 17 laps available after the out-lap, then comparing that threshold with the observed
clean-air strategy-package advantage.
George Russell
The lower break-even threshold
Measured VSC stop cost
16.7 seconds
Laps available after the out-lap
17
Required average recovery
0.98 seconds per lap
Observed clean-air strategy-package advantage
1.26 seconds per lap
Theoretical break-even
Approximately lap 58.2
Reached within two seconds of Sainz
Lap 57
Lewis Hamilton
A larger cost, but a larger observed advantage
Measured VSC stop cost
19.4 seconds
Laps available after the out-lap
17
Required average recovery
1.14 seconds per lap
Observed clean-air strategy-package advantage
1.54 seconds per lap
Theoretical break-even
Approximately lap 57.6
Reached within two seconds of Sainz
Lap 58
View full resolution
Clean-air pace exceeded the break-even requirement before traffic interrupted the recovery. The shaded
period identifies the leading-group and DRS-train phase. Select the chart to inspect the full-resolution
figure.
The outcome
Mercedes solved the catching problem, not the passing problem
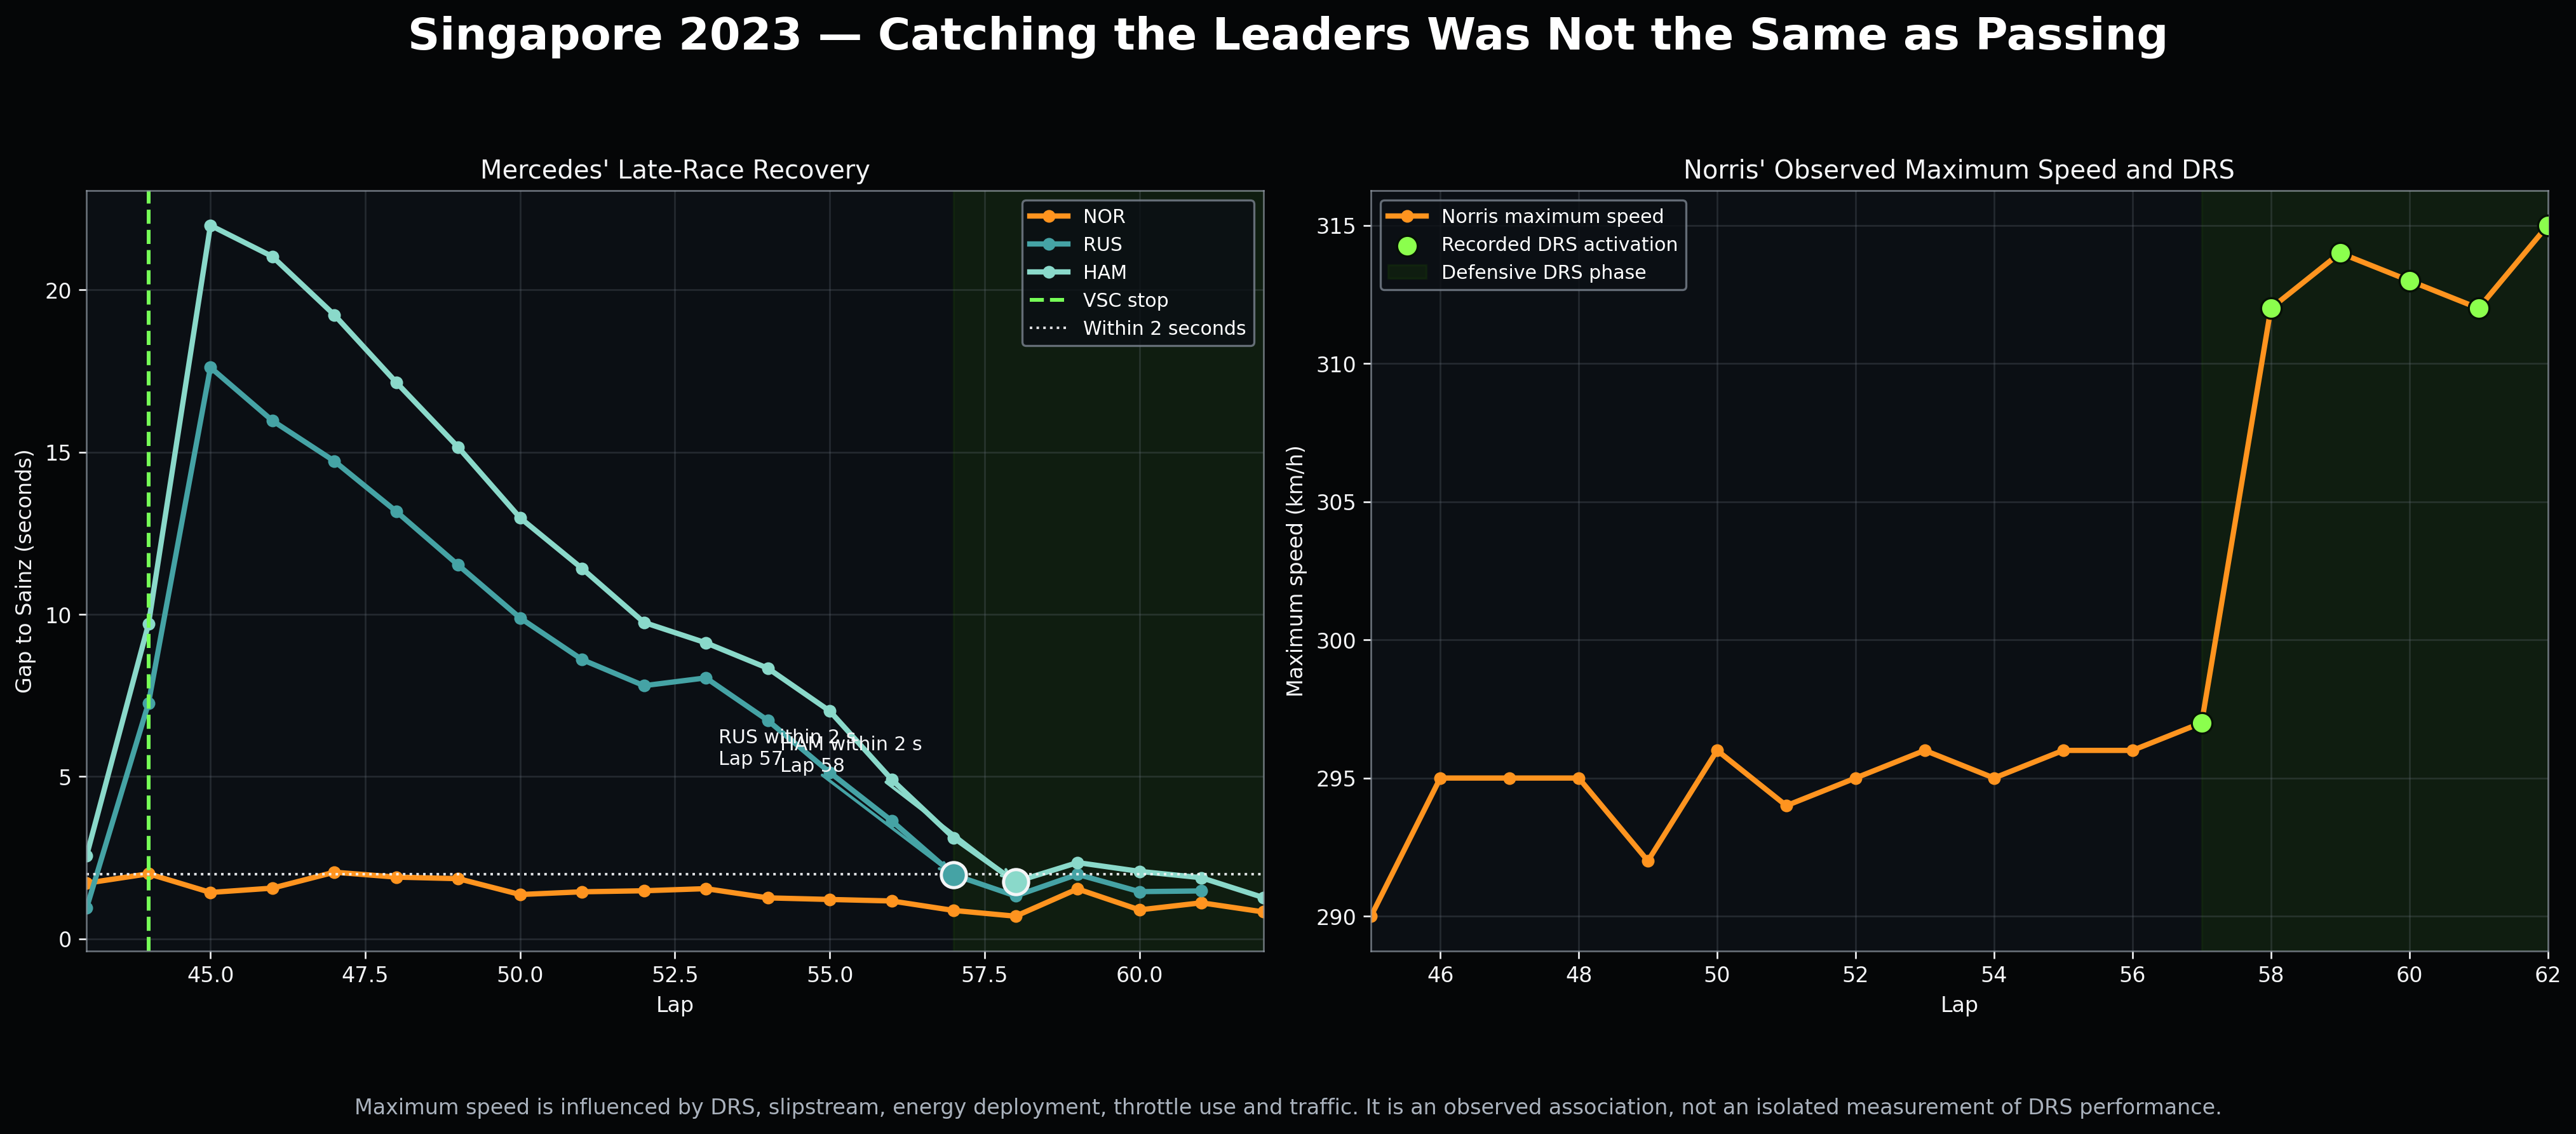
The fresh-medium pace was sufficient to bring Mercedes back to the leading group. Russell reached within
two seconds of Sainz on lap 57, and Hamilton reached the same threshold on lap 58.
Once Mercedes arrived, the cars were no longer operating in clean air. Sainz kept Norris close enough to
receive DRS, strengthening Norris’ straight-line defence. Mercedes had recovered the gap, but overtaking
the coordinated leading pair was a separate task.
Lap 57Russell within two seconds of Sainz
Lap 58Hamilton within two seconds of Sainz
Laps 57–62Leading-group and defensive-DRS phase
View full resolution
Mercedes reached the leaders as Norris entered a sustained defensive-DRS phase. Maximum speed is an
observed association affected by several race conditions, not an isolated DRS-performance measurement.
Select the chart to inspect the full-resolution figure.
“Mercedes had enough fresh-medium pace to make the VSC stop a rational, high-upside attempt to win. The
stop brought both cars back to the leaders, but the resulting DRS train prevented the theoretical tyre
advantage from converting cleanly into track position.”
Supporting mechanism
Why the DRS defence mattered
The DRS evidence helps explain the race’s final phase, but it does not replace the tyre decision as the main
analytical question.
Mean finish-line gap to Sainz, laps 57–62
Approximately 0.99 seconds
Finish-line gap range
Approximately 0.70–1.54 seconds
Recorded defensive-lap DRS activation
All six laps
Sustained DRS telemetry
Laps 58–62
Norris’ observed mean maximum speed
Approximately 294.6 km/h in the comparison period; 313.2 km/h in sustained-DRS samples
Maximum-speed difference relative to Sainz
Increased by approximately 15.1 km/h
OpenF1 recorded DRS activation on each of the six defensive laps from 57 through 62, with sustained DRS
telemetry observed from laps 58 through 62. Norris’ mean finish-line gap remained near the one-second
threshold, although that finish-line measurement is only a proxy for the official DRS detection-point gap.
Maximum speed is affected by DRS, slipstream, energy deployment, throttle use, and traffic. The change is
therefore an observed association consistent with the defensive mechanism, not an isolated causal
measurement of DRS performance.
In the
official post-race press conference, Sainz explained that he deliberately kept Norris within DRS
range. That intent is attributed to Sainz’s comments; telemetry alone does not establish it.
Verdict
The stop was justified
Mercedes needed roughly 0.98–1.14 seconds per lap to overcome the measured VSC stop loss. The observed
clean-air strategy-package advantage exceeded those thresholds, and both cars reached the leaders before the
finish.
The decision created a credible opportunity to win, but traffic, overtaking difficulty, and the
Sainz–Norris DRS arrangement prevented the clean-air advantage from continuing. It was a rational,
high-upside attempt—not a strategy that guaranteed a Mercedes victory.
Transparency
Methodology and limitations
Data and lap treatment
Race data came primarily from OpenF1.
Completed lap records were used for Sainz, Norris, Russell, and Hamilton.
Lap 45 was treated as the Mercedes out-lap.
Laps 46–56 were used as the cleaner pre-traffic comparison window.
Cumulative lap times were used to reconstruct gaps.
Incomplete records excluded
Incomplete final timing-feed placeholders were excluded:
Sainz: lap 63
Norris: lap 63
Hamilton: lap 63
Russell: lap 62
Completed laps retained
Sainz
62
Norris
62
Hamilton
62
Russell
61
Interpretive limits
“Strategy-package advantage” is used because the measured difference combines tyre, car, driver,
traffic, energy deployment, and pace-management effects.
The observed lap-time trend is not presented as pure tyre degradation.
Finish-line gap is only a proxy for the official DRS detection-point gap.
Maximum-speed observations are not a pure measurement of DRS gain.
Theoretical break-even extends clean-air pace and should not be read as proof of equivalent realised
elapsed-time recovery once the Mercedes drivers reached traffic.