F1 PACE ANALYSIS · CASE 04 · BAHRAIN 2024 PILOT
From Practice to Race Day: Does FP2 Long-Run Pace Predict Formula 1 Race Pace?
A Bahrain 2024 methodology pilot that locks an FP2 estimate before comparing it with a separately constructed race-pace benchmark from public OpenF1 timing data.
Independent analysis using publicly available data. Not affiliated with Formula 1 or any Formula 1 team.
- Predictive modelling
- Race pace
- Robust regression
- Traffic filtering
Key results
The Bahrain validation in six measures
The locked FP2 model closely tracked the separately constructed, traffic-filtered race estimate in this pilot, while retaining meaningful error and one clear constructor-level miss.
- Pearson correlation
- 0.884
- Spearman correlation
- 0.939
- Mean absolute error
- 0.250 s/lap
- RMSE
- 0.328 s/lap
- Pairwise ranking accuracy
- 91.1%
- Top-three overlap
- 2/3
Research question
Can FP2 long-run pace predict race-day competitive order?
This project tests whether adjusted FP2 long-run pace predicts adjusted, traffic-filtered race pace and competitive order. The FP2 prediction was locked before the race sample was constructed, keeping the race analysis as a separate validation rather than allowing the race result to reshape the FP2 model. This mirrors an early-weekend strategy task: form a pre-race view from incomplete practice data, then test it against later evidence without back-fitting.
Data and cleaning pipeline
Two independently audited pace samples
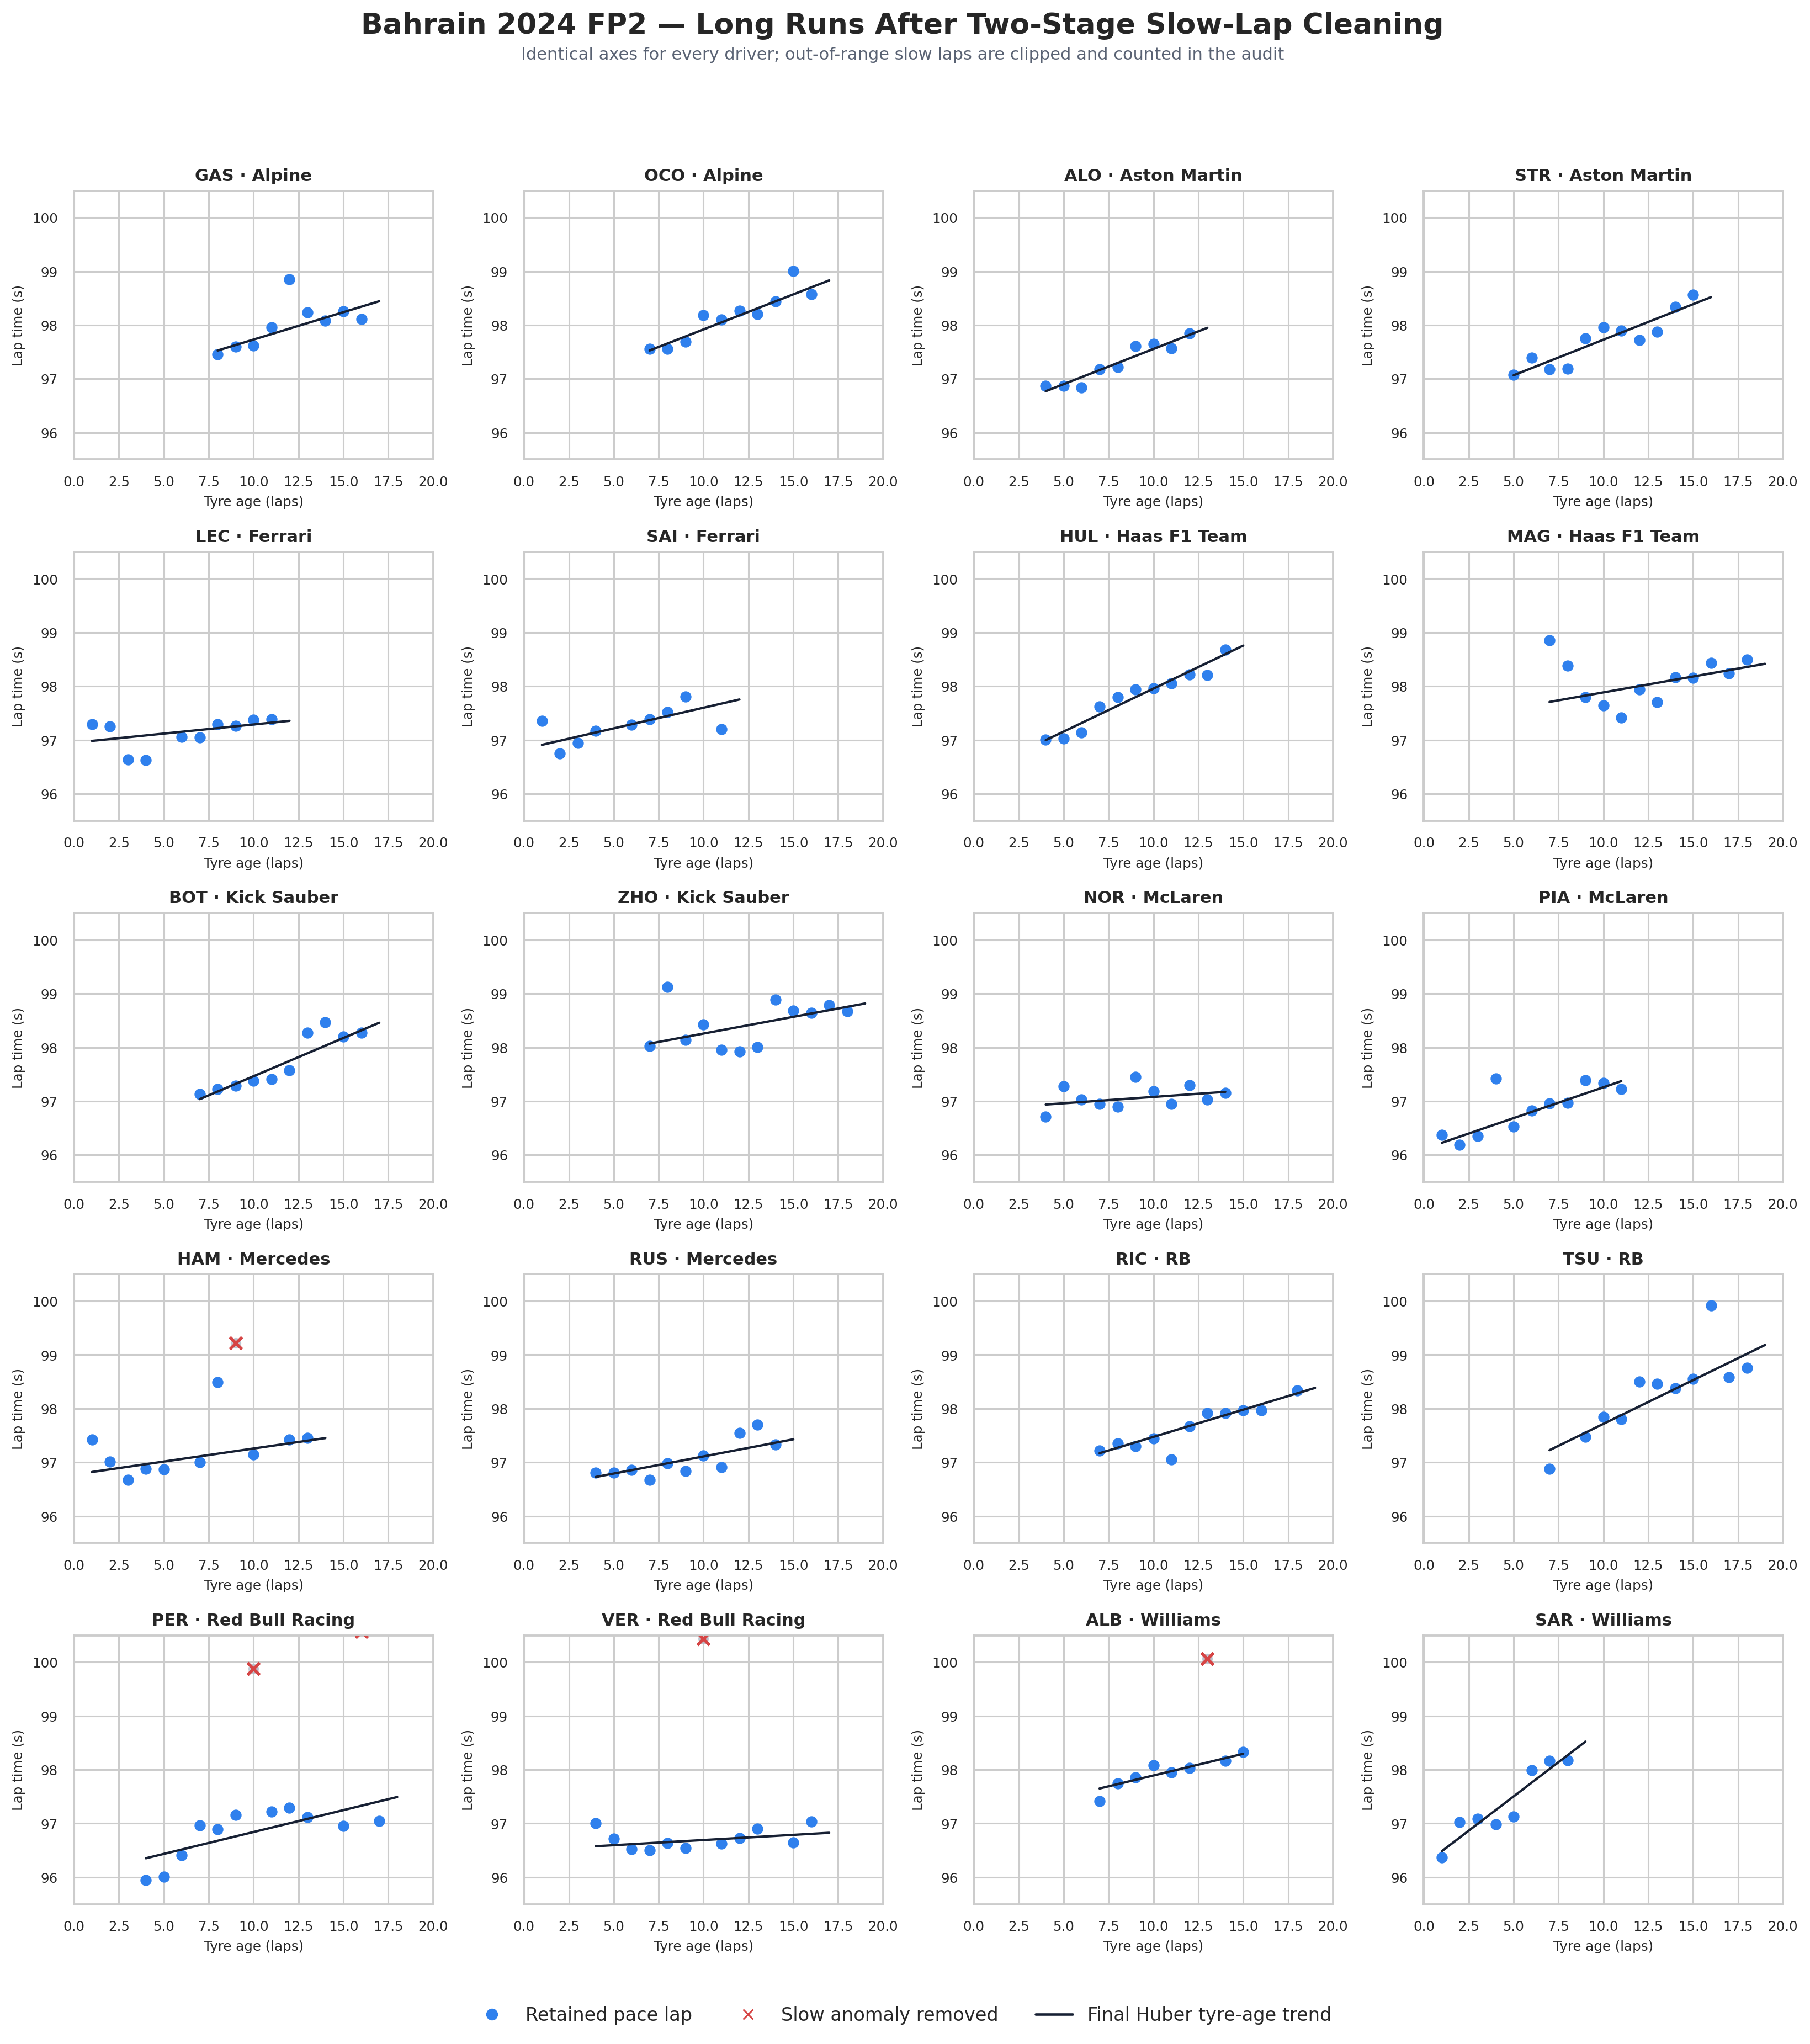
Public timing feeds were filtered into one representative FP2 long run per driver and a separate, traffic-filtered race sample, with each exclusion preserved in the audit trail.
- Source data OpenF1 supplied lap, stint, tyre, weather, race-control, position and interval data
- FP2 sample One genuine FP2 long run selected for each of the 20 drivers
- Lap audit Pit laps, incomplete laps, interruptions, anomalously slow laps and observable traffic audited, with each exclusion reason recorded
- Race traffic A 2.0-second exclusion threshold applied using the official interval-to-car-ahead feed
- Pace adjustment Robust regression accounted for tyre compound, tyre age, track temperature and session progression
- Final race model The final race model retained 539 laps across 39 stints, 20 drivers and 10 constructors
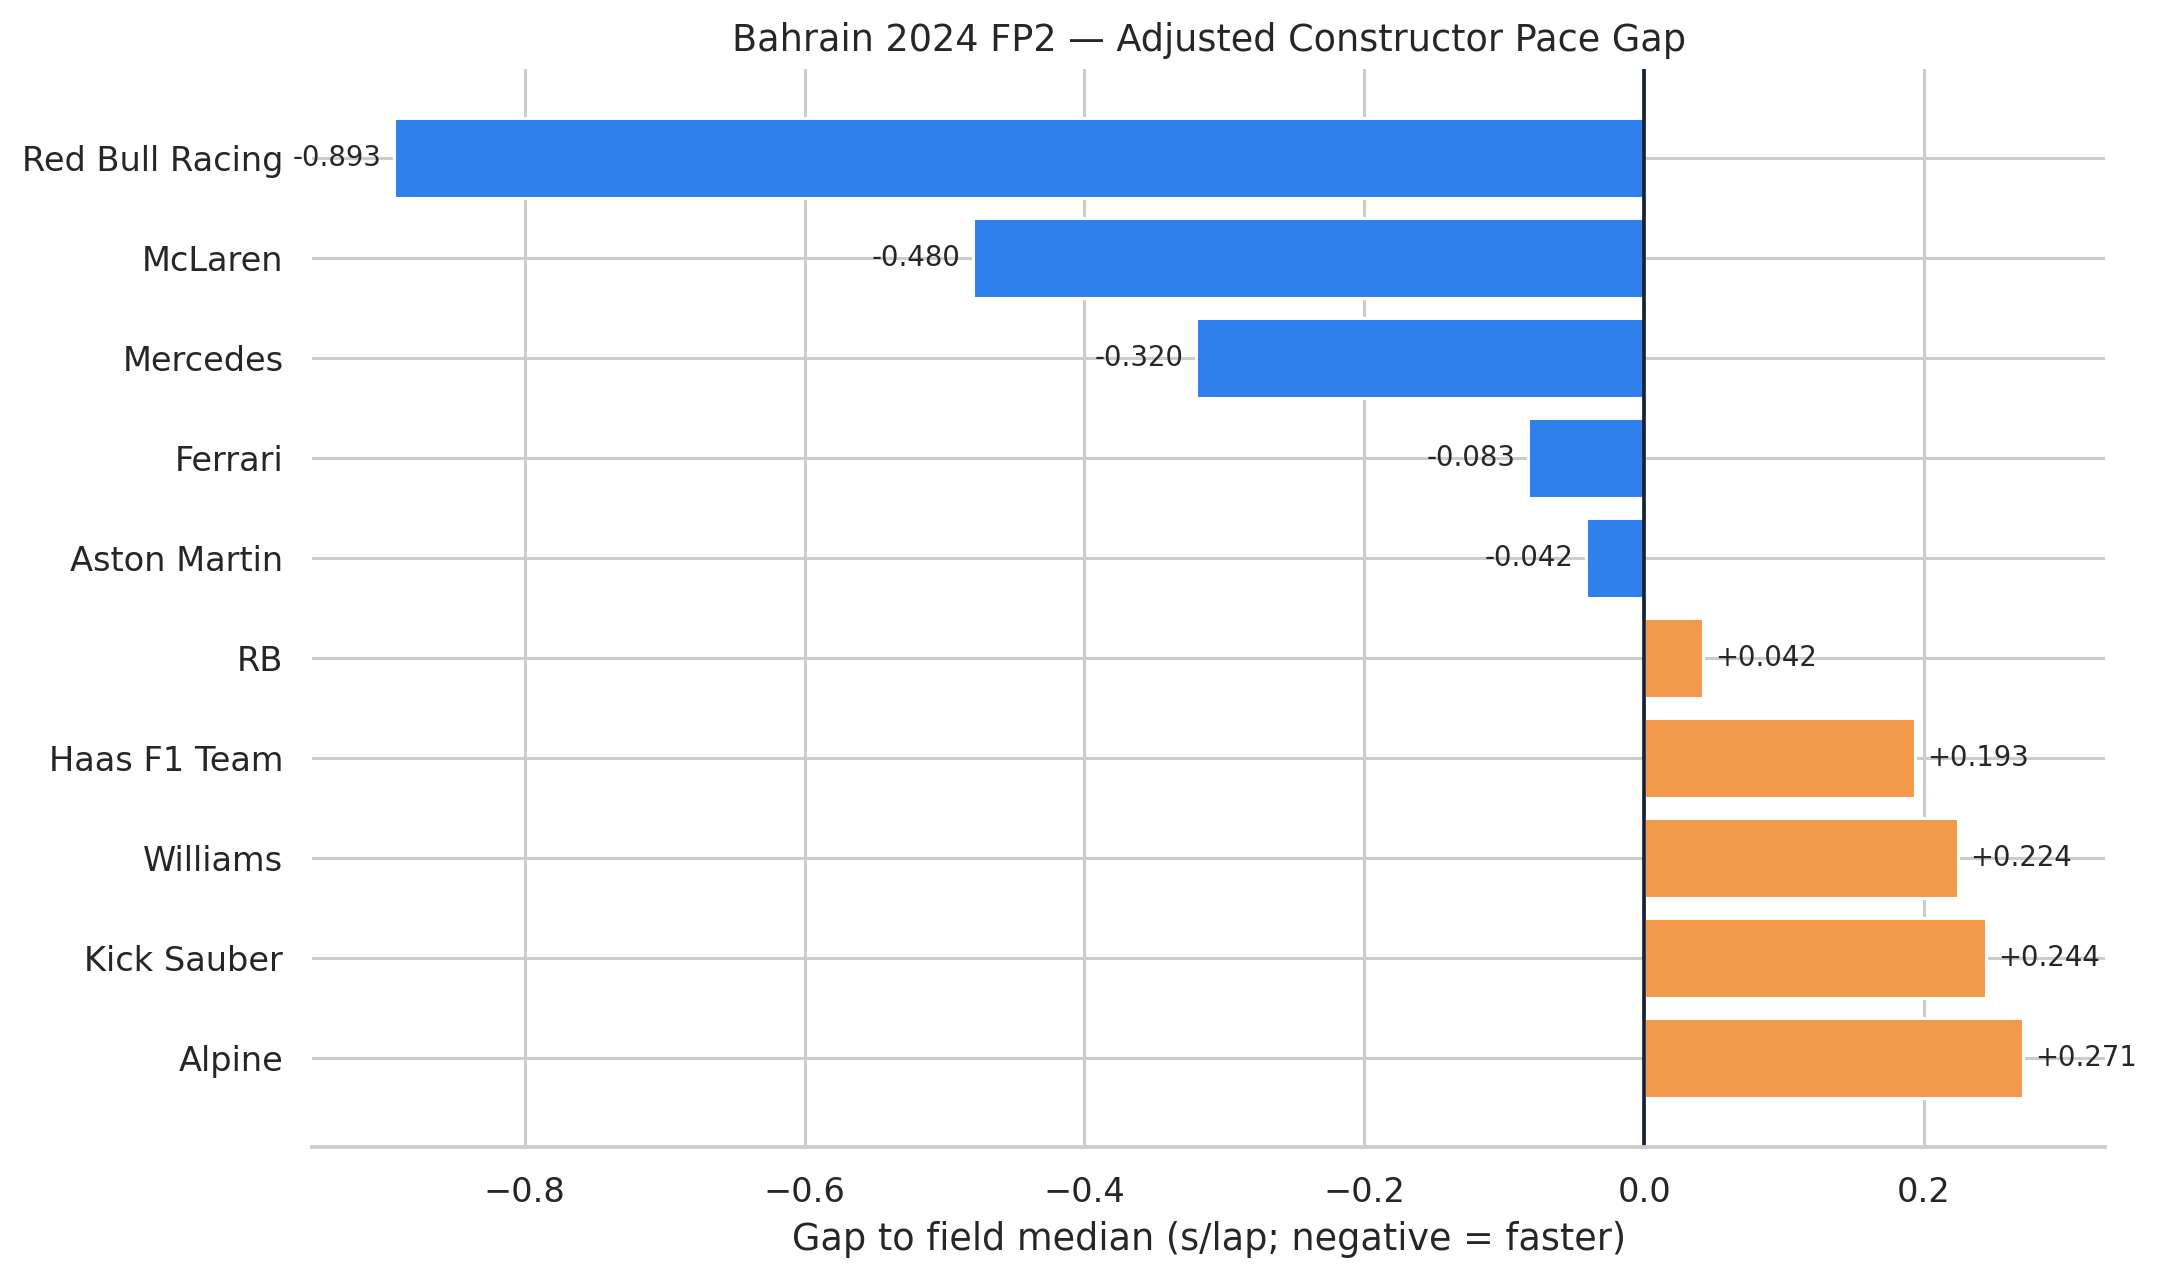
Adjusted FP2 prediction
Red Bull led the locked FP2 estimate
Negative values indicate faster-than-field-median adjusted pace. The FP2 model predicted Red Bull first, followed by McLaren and Mercedes.
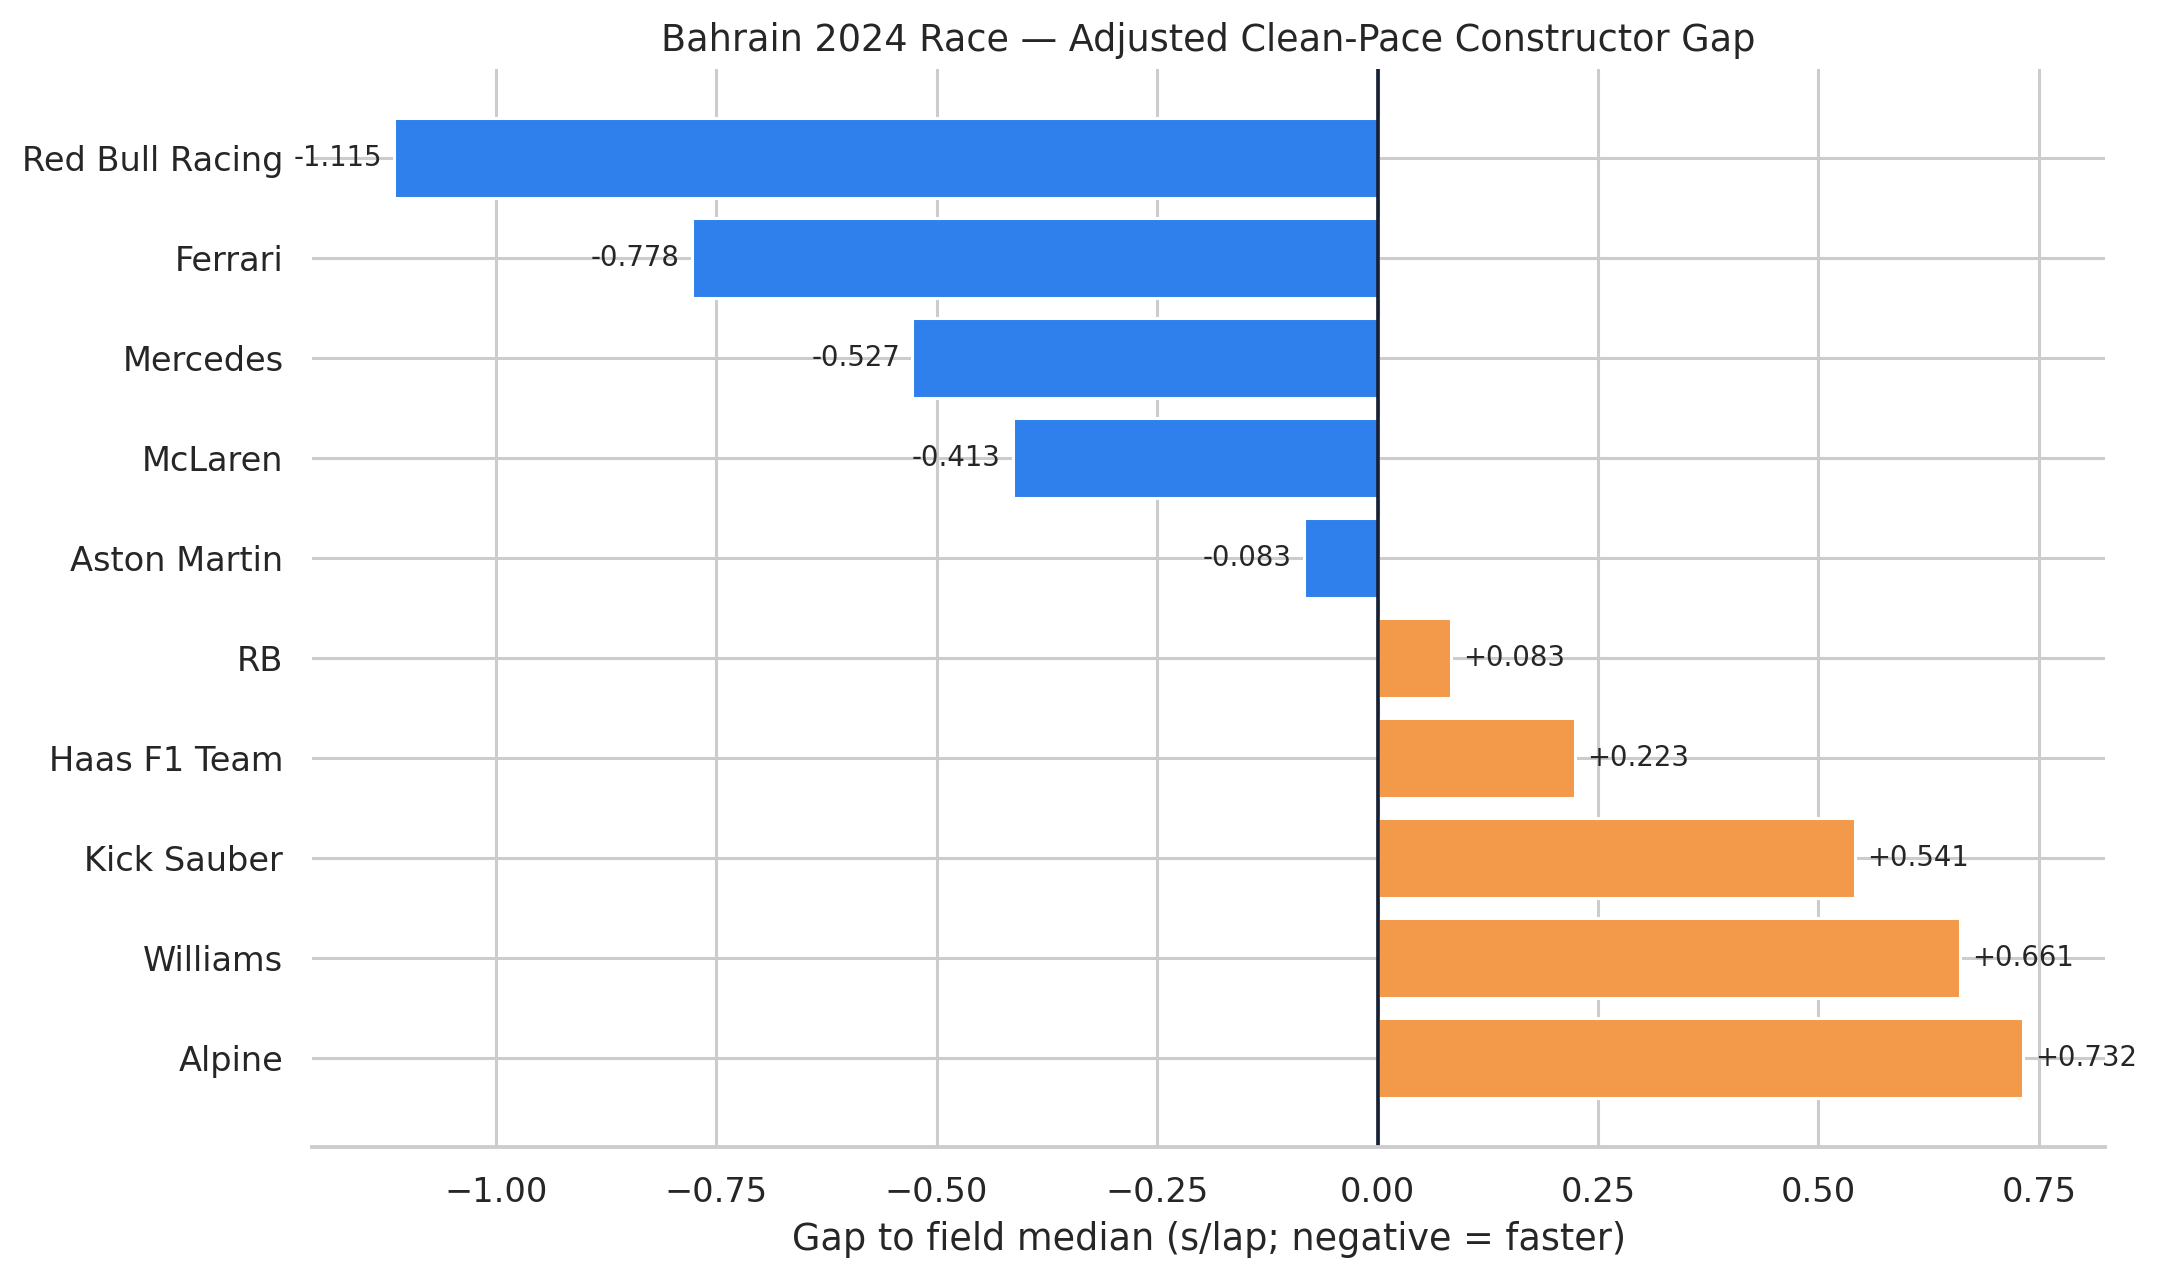
Adjusted traffic-filtered race pace
The independent race model moved Ferrari to second
The independently constructed race model ranked Red Bull first, Ferrari second, Mercedes third and McLaren fourth.
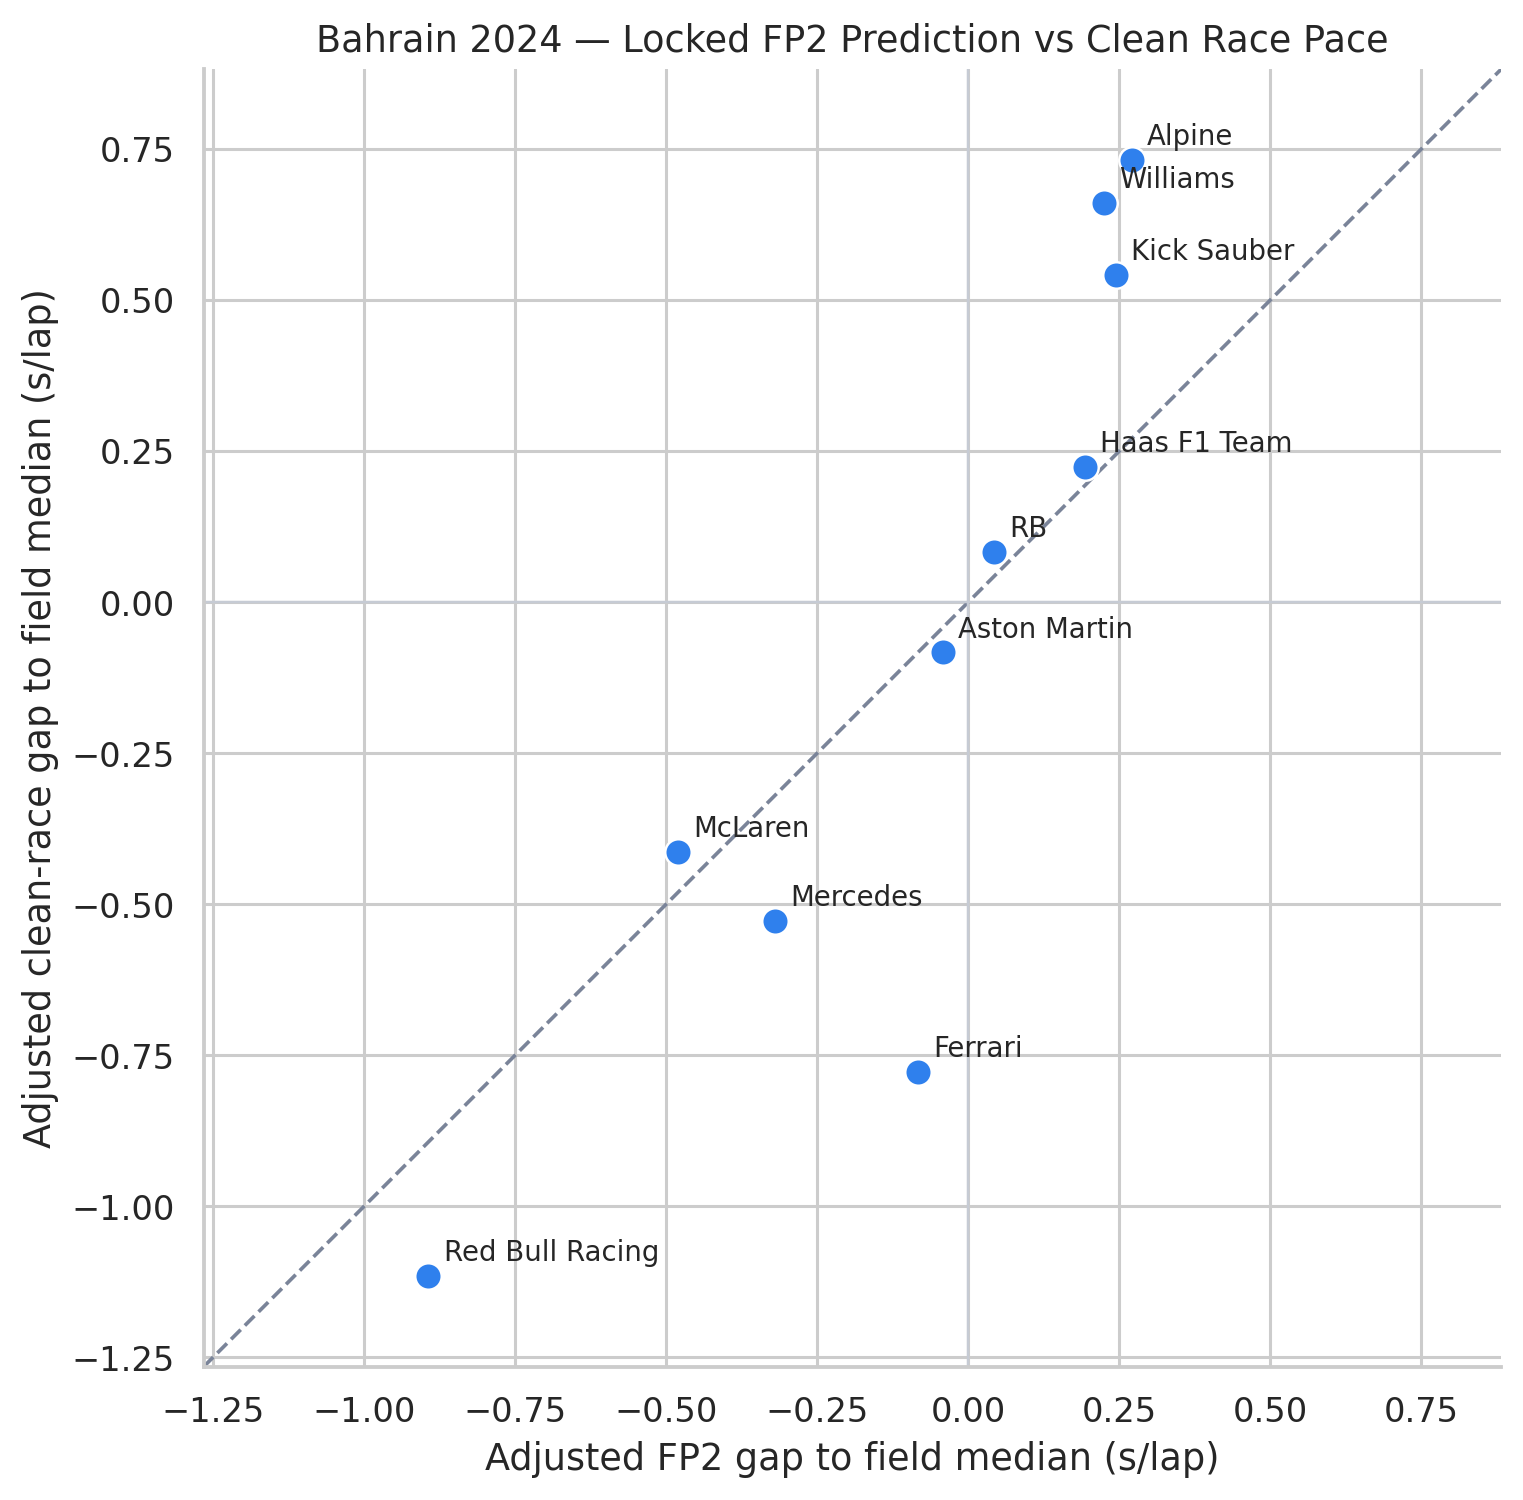
Prediction validation
Strong ordering signal, with Ferrari as the largest miss
The validation supports a strong Bahrain relationship between the locked FP2 prediction and traffic-filtered race pace, but it does not show that FP2 predicted the race perfectly.
-
Fastest constructor identified
FP2 identified Red Bull as the fastest constructor.
-
Largest miss
Ferrari was predicted fourth in FP2 but ranked second in traffic-filtered race pace.
-
Rank ordering largely retained
Eight of ten constructors finished within one rank of the FP2 order; Ferrari and McLaren each moved two positions.
-
Pairwise accuracy
FP2 correctly ordered 41 of 45 constructor pairings, or 91.1%.
Robustness
The ordering remained stable under a less conservative traffic filter
Lowering the race-traffic exclusion threshold from 2.0 to 1.5 seconds applied a less conservative filter and retained more laps. The main competitive ordering and validation metrics remained close to the primary estimate.
- Retained laps
- 539 → 603Increase under the less conservative 1.5-second filter.
- Smallest driver sample
- 5 → 13Minimum retained laps across drivers.
- Race-order stability
- 0.988Spearman correlation versus the primary race estimate.
- Validation Spearman
- 0.939 → 0.927Primary estimate versus the result under the less conservative filter.
- Mean absolute error
- 0.250 → 0.270 s/lapPrimary estimate versus the result under the less conservative filter.
Limitations
What this pilot cannot establish
The result is a relative constructor-level validation for one event, not a general claim that practice pace will predict every race.
- FP2 fuel loads are unobservable.
- Fuel burn and tyre degradation cannot be perfectly separated.
- FP2 traffic detection relies on approximate location data.
- The validation contains only 10 constructor-level observations from Bahrain 2024, so its correlations describe this event rather than general predictive reliability.
- Driver pace management and strategy effects remain only partly observable in public timing data.
- Bahrain’s closely matched evening FP2 and race conditions may make it unusually favourable.
- The outputs are relative constructor gaps, not predictions of absolute lap time.