Introduction
In professional golf, distance off the tee is often viewed as a major advantage because it gives players shorter approach shots and better scoring opportunities. As Tiger Woods famously remarked, "The most important club in the bag is the driver, as you can cheat holes, cut corners, and take things out of play with it." Yet the reality is more nuanced. Many tour champions rank highly in driving distance, but longer shots also carry more risk: the longer the ball stays in the air, the more likely hazards, rough, or missed fairways are to come into play. This analysis examines the relationship between driving distance and winning potential, using PGA Tour data from the 2022–2023 season to explore whether longer drives consistently correlate with leaderboard success.
Evolution of Driving Distance
Distance Insights Report
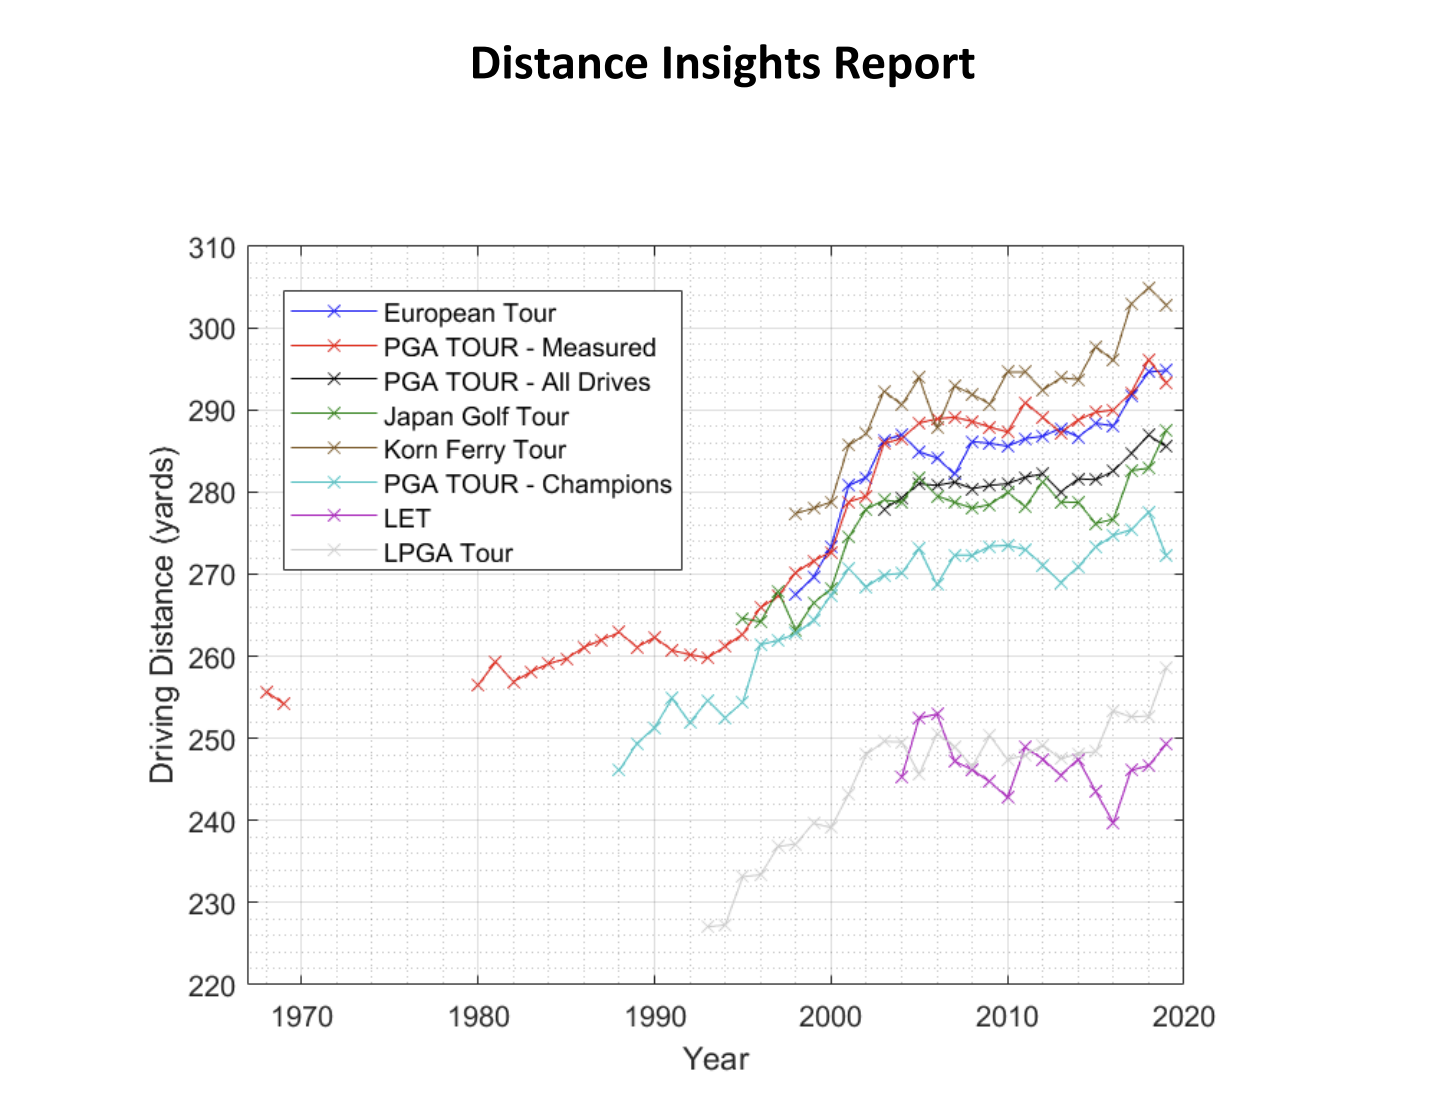
Driving distance in professional golf has increased significantly over time, driven by advances in equipment technology, player fitness, and swing optimisation. The preceding chart comes from the 2020 Distance Insights Report, a collaborative study from the USGA and The R&A. It shows that professional driving distances have steadily increased across tours, reflecting the combined influence of modern technology, athleticism, and refined technique.
Case study: Bay Hill Club & Lodge, hole 6 (par 5)
Longer drives provide players with a significant advantage, allowing them to approach greens with shorter, more precise clubs and improving their scoring opportunities. This is particularly evident on challenging holes such as the par-5 sixth hole at Bay Hill Club & Lodge, where driving distance can substantially change the strategy.

Players like Bryson DeChambeau, known for exceptional power, have shown how cutting across the water hazard with a long drive can leave only a short approach to the green, effectively turning a traditional three-shot hole into a potential eagle opportunity. By contrast, most of the field takes the safer route around the water, adding distance to the second shot and relying on precision to stay in play. This example shows why distance matters strategically, but distance alone does not guarantee leaderboard success. Rory McIlroy, Brandon Matthews, and the tour median illustrate that distinction.
| Player | Average Driving Distance (yards) | Official Earnings (USD) |
|---|---|---|
| Rory McIlroy | 326.30 | $8,536,500 |
| Brandon Matthews | 321.30 | $15,762 |
| Tour Median | 300.05 | $711,949.50 |
Dataset calculated from official PGA Tour statistics for the 2022–2023 season.
Rory McIlroy’s average driving distance of 326.30 yards aligns with his strong official earnings total of $8,536,500, but this pattern does not hold universally. Brandon Matthews averaged a similar 321.30 yards yet earned only $15,762. Meanwhile, the tour median driving distance of 300.05 yards corresponds to much higher earnings of $711,949.50. This comparison suggests that while driving distance is important, consistency, short-game performance, and putting also play critical roles in determining leaderboard success.
Definitions
United States Golf Association (USGA): The organisation that governs golf in the United States and Mexico. The USGA creates the rules, runs major tournaments such as the U.S. Open, and works to grow and protect the game.
Royal and Ancient Golf Club of St Andrews (R&A): The organisation that oversees golf everywhere except the United States and Mexico. The R&A works alongside the USGA to administer the Rules of Golf, set equipment standards, and organise major championships.
Driving Distance: Total distance measured from the teeing ground to the point where the ball comes to rest, regardless of location (fairway, rough, bunker, putting green, etc.). (USGA)
Official Earnings: Total official prize money earned by a PGA Tour member during the season. This differs from FedExCup points, which use a separate ranking system.
Linear Regression: A statistical method that models the relationship between a dependent variable and one or more independent variables by fitting a linear equation to observed data. The equation has the form Y = mX + c, where Y is the predicted value, m is the slope of the line, and c is the y-intercept. (LibreTexts Stats)
R-squared: A statistical measure indicating the proportion of variance in the dependent variable that can be predicted from the independent variable(s). It ranges from 0 to 1, with higher values indicating a stronger fit. (LibreTexts Stats)
P-value: The probability of obtaining results at least as extreme as the observed results, assuming the null hypothesis is true. A common threshold for statistical significance is p < 0.05. (LibreTexts Stats)
Bin Analysis: The process of dividing continuous data into discrete intervals, or "bins", to make distributions, frequencies, and trends easier to interpret.
Sourcing the Dataset
Three major professional tours were considered when sourcing a reliable dataset for elite-level golf performance: the PGA Tour, LIV Golf, and the DP World Tour.
Why the PGA Tour?
The PGA Tour provides the most complete and accessible dataset for this analysis. LIV Golf is excluded because its format and incentive structure differ substantially, making direct comparisons less reliable for this purpose. The DP World Tour is also excluded because its public data is less detailed and accessible than PGA Tour data.
Selecting the Relevant Statistics
From PGA Tour statistics, we selected two datasets from the latest complete season available for the project, 2022–2023:
- Dataset 1 - Driving Distance: https://www.pgatour.com/stats/detail/101
- Dataset 2 - PGA Tour Official Money: https://www.pgatour.com/stats/official-money
Official earnings were chosen as the measure of tournament success because they share the same competition timeline as the driving-distance statistics, making player and tournament comparisons more consistent.
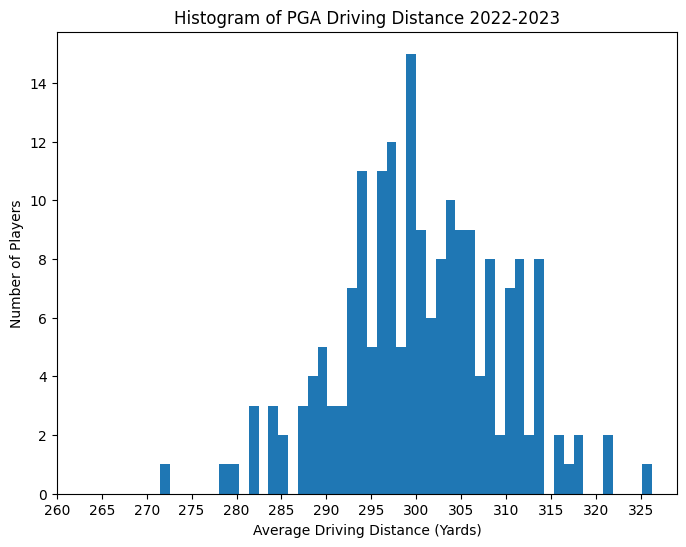
Dataset 1: Driving Distance
The histogram displays the average driving distances, in yards, for PGA Tour players during the 2022–2023 season. It shows a central cluster around the 295–305-yard range, with fewer players averaging more than 310 yards or less than 280 yards. This indicates that most players perform within a relatively narrow range of driving distances, highlighting the consistency of the professional field.
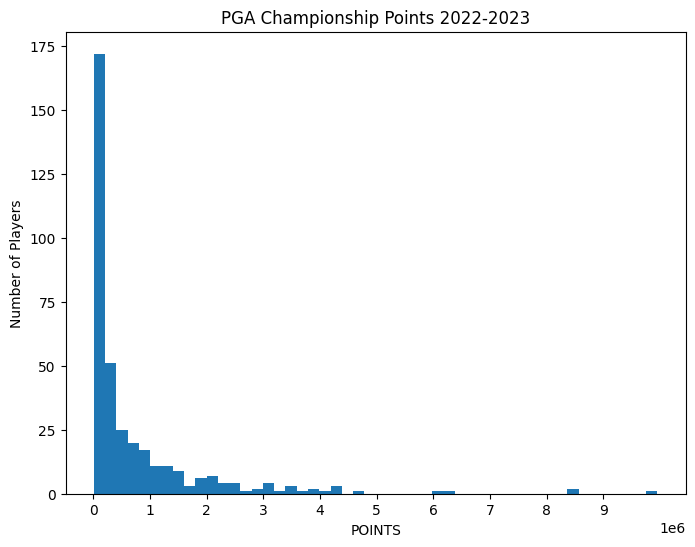
Dataset 2: PGA Tour Official Earnings
The histogram displays the distribution of official earnings for players in the 2022–2023 season. It is strongly skewed, with most players earning less than $1 million and only a small number exceeding that total. This reflects the disparity in performance across the field.
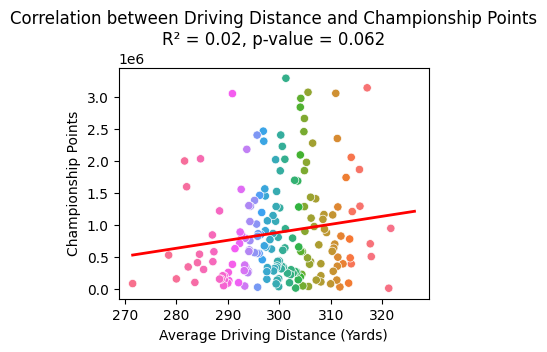
Terminology correction: The original charts below label the outcome measure as “Championship Points”. The PGA Tour source and the million-scale values represent official earnings, so the surrounding analysis uses the corrected term.
Methodology
This analysis uses linear regression to study the relationship between driving distance and official earnings. The first regression uses the complete dataset, accounting for every PGA Tour player and providing a comprehensive view of the relationship.
Next, the 1.5 × IQR rule is used to identify and remove statistical outliers before the regression is run again. Comparing the two models shows whether extreme data points materially affect the observed relationship.
The two approaches are:
- Linear regression on the full dataset
- Linear regression with outliers removed
More on Linear Regression
Linear regression is used in this analysis to explore the relationship between driving distance (independent variable) and official earnings (dependent variable). This method helps determine whether longer drives can predict higher earnings. The underlying assumption of linear regression is that the relationship between these variables is linear, meaning that as driving distance increases or decreases, official earnings are expected to change proportionally.
The regression equation can be expressed as: Official Earnings = (m × Driving Distance) + c, where m represents the slope, or the rate of change in earnings for each yard of driving distance, and c is the y-intercept.
Two key results from the regression analysis are:
R-squared (R²): This measures how much of the variation in official earnings is explained by driving distance. For example, an R² value of 0.04 (4%) indicates that driving distance accounts for only a small proportion of the variation, suggesting other factors significantly influence earnings.
P-value: This indicates how compatible the observed data are with a null hypothesis of no linear association. A p-value below 0.05 is conventionally treated as evidence against that hypothesis; it does not measure the probability that a relationship is coincidental. In this analysis, the p-value of 0.005 suggests a measurable, though limited, association between driving distance and official earnings.
While linear regression helps quantify this relationship, the relatively low R² value in this study highlights that factors beyond driving distance—such as short-game performance, putting, and consistency—are critical in determining a golfer’s success.
Findings
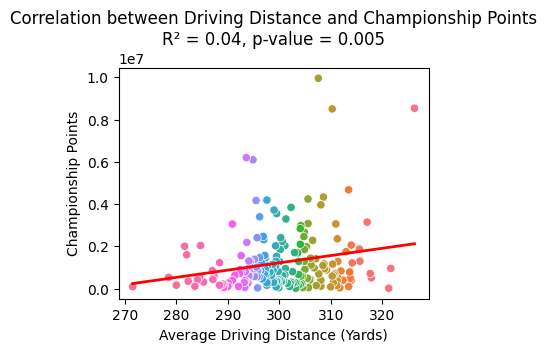
Linear Regression: Coefficient of Determination R² = 0.04
p-value: 0.005
The linear regression results show a statistically significant association between driving distance and official earnings (p-value = 0.005), but the model’s explanatory power is limited, as indicated by the low R² value of 0.04. Driving distance explains only 4% of the variation in earnings within this model. The scatterplot further illustrates the weak relationship, with data points widely dispersed around the regression line and other factors playing a much larger role in tournament success.
Linear Regression with Outliers Removed: Coefficient of Determination R² = 0.02
p-value: 0.062
The regression with outliers removed shows an even weaker relationship. The p-value increases to 0.062, which is above the conventional 0.05 threshold for statistical significance, while the R² value falls to 0.02. This means that driving distance explains only 2% of the variation in official earnings in the reduced dataset. The scatterplot reinforces the limited strength of the relationship, with points widely dispersed around the regression line.
Discussion
Explaining the Drop in R²
The lower R² value after removing outliers suggests that those observations contributed to the apparent relationship between driving distance and official earnings. Although they sit far from the main cluster, some outliers may still align with the overall trend and exert substantial influence on the regression line.
Once those observations are removed, the remaining data shows less evidence of a linear relationship, reducing the proportion of variation explained by the model.
Explaining the Increase in P-value
The p-value increases from 0.005 to 0.062 after outliers are removed. Because 0.062 is above the conventional 0.05 threshold, the relationship is no longer statistically significant in the reduced dataset.
This change does not mean that the second model is inherently better or worse. Instead, it shows that the statistical evidence for a linear relationship is sensitive to the influential observations removed by the IQR rule. In both models, the low R² value indicates that driving distance alone is a weak predictor of official earnings.
Key Point: Removing outliers does not always produce a stronger correlation.
Conclusions
In the full dataset, driving distance has a statistically significant but limited association with official earnings. After outliers are removed, the relationship becomes weaker and is no longer statistically significant at the 0.05 level. These results highlight the importance of factors beyond driving distance—such as short-game performance, putting, and consistency—in determining leaderboard success. They also demonstrate the limitations of relying on a single performance metric and the influence that outliers can have on regression results. Future studies could extend the analysis by incorporating metrics such as putting accuracy, greens in regulation, and approach play.
Sources
PGA Tour Stats - Driving Distance: https://www.pgatour.com/stats/detail/101
PGA Tour Stats - Official Money: https://www.pgatour.com/stats/official-money
USGA Distance Insights Report (2020): https://www.usga.org/content/usga/home-page/advancing-the-game/distance-insights.html
The R&A: https://www.randa.org/
LibreTexts Statistics - Linear Regression and Statistical Concepts: https://stats.libretexts.org/